Unlock a world of possibilities! Login now and discover the exclusive benefits awaiting you.
- Qlik Community
- :
- All Forums
- :
- QlikView Administration
- :
- Explanation for Performance Variance
- Subscribe to RSS Feed
- Mark Topic as New
- Mark Topic as Read
- Float this Topic for Current User
- Bookmark
- Subscribe
- Mute
- Printer Friendly Page
- Mark as New
- Bookmark
- Subscribe
- Mute
- Subscribe to RSS Feed
- Permalink
- Report Inappropriate Content
Explanation for Performance Variance
I've run across a strange performance variance I don't understand.
LineTotal is a measure in the fact table.
UI_CurrencyRate is in a data Island with always one selected.
Using a dimension of Category with 41 values, these three expressions perform about the same:
#1. Sum(LineTotal * UI_CurrencyRate)
#2. Sum(LineTotal) * only(UI_CurrencyRate)
#3. Sum(LineTotal * $(=only(UI_CurrencyRate)))
If I add a second dimension "Year-Qtr" (6 values) into the chart, expression #2 now takes 5 times longer to run! Year-Qtr is 3 hops away from Category. Same performance if I use "Channel" (4 values, 3 hops) as my second dimension.
But if I use "Product" (295 values,1 hop, same side of the fact table) as the second dimension, all three expressions perform the same again!
Can anyone explain in QV Engine terms what is going on with that second expression? And why it doesn't it perform poorly on my third example?
The attached example demonstrates the issue. If you open it and walk through the sheets in order you'll see the differences for each combination.
Thanks for any insight. 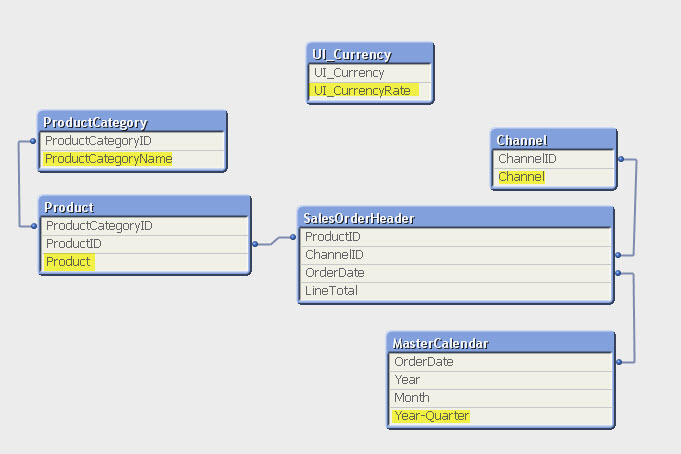
-Rob
- Tags:
- qlikview_deployment
- Mark as New
- Bookmark
- Subscribe
- Mute
- Subscribe to RSS Feed
- Permalink
- Report Inappropriate Content
Strange, for me all the options on all the tabs are fast, whatever I do / click. Is there something special I need to do to make it slow ?
I am using QV Desktop 11.20 SR6 on a bog standard year old laptop with 2 * 1.9 GHz physical cores, hyperthreaded to 4 logical processors and 8 GB RAM.
- Mark as New
- Bookmark
- Subscribe
- Mute
- Subscribe to RSS Feed
- Permalink
- Report Inappropriate Content
Well, at least I can reproduce the issue using 11.20.12852.0409 on Win7X64.
But I am not able explain it right now.
- Mark as New
- Bookmark
- Subscribe
- Mute
- Subscribe to RSS Feed
- Permalink
- Report Inappropriate Content
#1. Sum(LineTotal * UI_CurrencyRate)
#2. Sum(LineTotal) * only(UI_CurrencyRate)
#3. Sum(LineTotal * $(=only(UI_CurrencyRate)))
I would expect an aggregation of a product to be cheaper than a product of two aggregations. That fits with the second expression being slower than the others.
Doing the second aggregation outside the chart context performs pretty good too:
#4. Sum(LineTotal) * $(=only(UI_CurrencyRate))
When Product is used as dimension then both ProductCategoryName and LineTotal are 1 hop away and on the same side of the fact table. In all other cases where two dimensions involve a hop over the fact table the performance takes a hit. The combinations Product - Channel, Channel - Year-Quarter and Product - Year-Quarter exhibit the same behaviour.
Very interesting. I hope somebody can explain it in more technical detail.
talk is cheap, supply exceeds demand
- Mark as New
- Bookmark
- Subscribe
- Mute
- Subscribe to RSS Feed
- Permalink
- Report Inappropriate Content
- Mark as New
- Bookmark
- Subscribe
- Mute
- Subscribe to RSS Feed
- Permalink
- Report Inappropriate Content
1. "Product" as 2nd dim is faster than "Year-Qtr" and "Channel" as 2nd dim
This does not surprise me. "Product" and "Category" are the same dimension, basically. Together there are only 295 combinations and these can be generated without running through the fact table. Whereas the "Category"-"Channel" combinations can only be found by running through the (large) fact table and creating the necessary lookup-tables.
2. Expression #3 is fast
This does not surprise me either. The dollar expansion is made before the other steps of the chart evaluation, resulting in one single value that is used all over the cube: The evaluation of the Only() function is really not part of the building of the cube.
3. Why is #2 slower than #1?
I haven't got a clue... I need to ask Håkan.
HIC