Unlock a world of possibilities! Login now and discover the exclusive benefits awaiting you.
- Qlik Community
- :
- All Forums
- :
- QlikView App Dev
- :
- How to hide/suppress null Expressions from a Pivot...
- Subscribe to RSS Feed
- Mark Topic as New
- Mark Topic as Read
- Float this Topic for Current User
- Bookmark
- Subscribe
- Mute
- Printer Friendly Page
- Mark as New
- Bookmark
- Subscribe
- Mute
- Subscribe to RSS Feed
- Permalink
- Report Inappropriate Content
How to hide/suppress null Expressions from a Pivot Table
Hi,
I am attempting to create a pivot table which has a number of expressions. When split by the 'Size' dimension some of these expressions (highlighted yellow) are null.
I would like to suppress these yellow expression columns which come back as null, but only at the lower level 'Size 1' 'Size 2' etc, while still showing at total level.
For info, the business reason for this is expressions 3&4 do not split by size, so are only meaningful at the Total level, and as Exp 5 = Exp 1 + Exp 3, and Exp 6 = Exp 2+ Exp 4, expressions 3 t6hrough to 6 have been requested visible only at the total level, in the same chart as Exp 1 & 2.
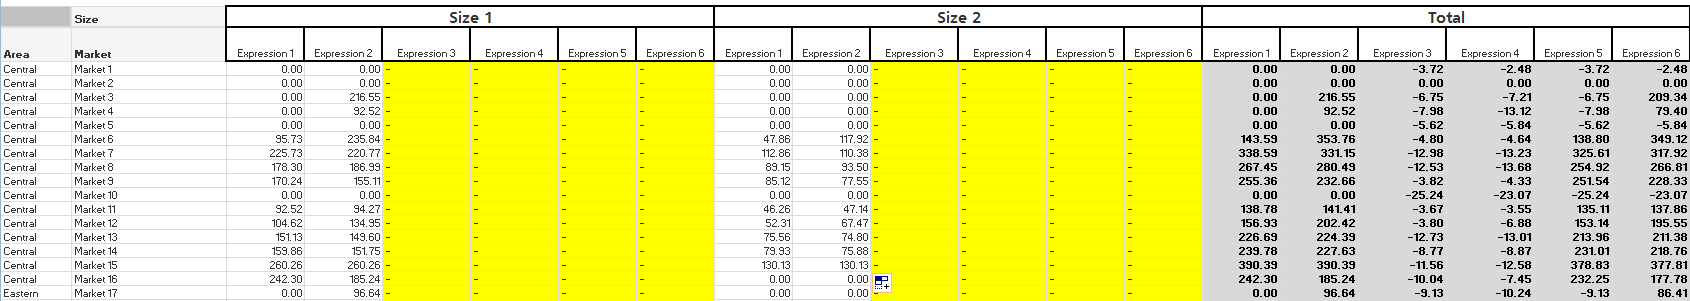
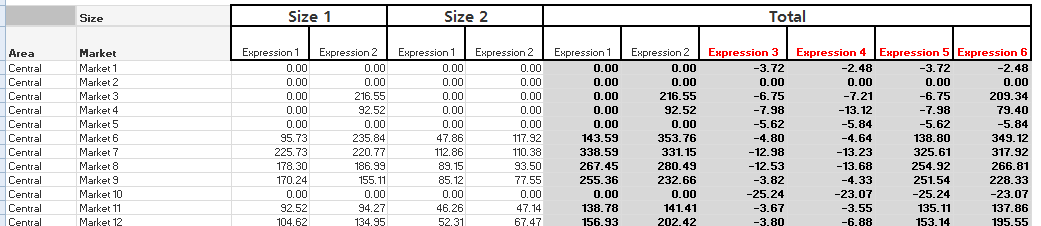
The intended end result would then be that Exp 1, Exp 2 are displayed split by size, while Exp 3/4/5/6 (which are all null by Size dimension) only show at the total level.(See below)
Does anyone have any suggestion on how best to suppress the null expression columns as shown?
For info, I have used the SecondaryDimensionality() function to help get to this point thinking the suppression would be the easy part  ...
...
Thanks in advance for your input.
Accepted Solutions
- Mark as New
- Bookmark
- Subscribe
- Mute
- Subscribe to RSS Feed
- Permalink
- Report Inappropriate Content
That's not possible. The expression columns will always be shown for all size values unless the expression returns only nulls or zeros for all rows for all values of the size dimension and also for the totals.
talk is cheap, supply exceeds demand
- Mark as New
- Bookmark
- Subscribe
- Mute
- Subscribe to RSS Feed
- Permalink
- Report Inappropriate Content
Thanks for coming back. I had tried to force that very issue using the secondarydimensionality() function as shown
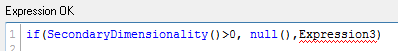
That is, Expression 3 will be null for all size values, except the total (which has secondarydimensionality=0).
I was hoping that by forcing these expressions as null over all size values I would be able to suppress at the individual sizes, while retain at the Total level. The difference I have from what you say is that these expressions are NOT null at the total level...
In that case, I may have to split the report (two pivot tables) perhaps to get the layout requirement, unless there are workarounds anyone is able to suggest....
Thanks
- Mark as New
- Bookmark
- Subscribe
- Mute
- Subscribe to RSS Feed
- Permalink
- Report Inappropriate Content
For information, the two approaches tested were to create side by side charts (not using a container object), and also using a straight table.
The side by side approach was more of a formatting and alignment exercise, which I used a VBScript macro to help with (column widths).
The straight table option meant using set analysis within multiple expressions to generate the required size splits that way, (rather than using the pivit by size dimension) such as
Exp_Size1 = sum({$<SIZE = {'Size1'}>} $(eMeasureName)).
Not ideal if many sizes...
As it happens, business requirements changed overnight to now be for two separate reports, so no need to see either of the above through to conclusion, rather I now have a Size split drill down report, and a summarised report (non size split) for the totals. 
Happy to share above workings if helps anyone.