Unlock a world of possibilities! Login now and discover the exclusive benefits awaiting you.
- Qlik Community
- :
- All Forums
- :
- Qlik NPrinting
- :
- NPrinting conditional row based export
- Subscribe to RSS Feed
- Mark Topic as New
- Mark Topic as Read
- Float this Topic for Current User
- Bookmark
- Subscribe
- Mute
- Printer Friendly Page
- Mark as New
- Bookmark
- Subscribe
- Mute
- Subscribe to RSS Feed
- Permalink
- Report Inappropriate Content
NPrinting conditional row based export
Hi there!
I hope my concern is in place in the community. I had a look at vizubis community and couldn't find a Q&A part in the community.
I just had a meeting concerning NPrinting. The client hat a question concerning the conditions.
Unfortunately I didn't find anything about this topic, so I thought I'd ask in the community.
In case there already are posts concerning this topic, but I didn't find them, I'm sorry for bothering.
Let's assume we've got the following Chart in QlikView:
| Client | Order | marginal return in % |
|---|---|---|
| Client A | 112545 | 12 |
| Client A | 124513 | 15 |
| Client B | 123465 | -7 |
| Client C | 124579 | 5 |
| Client D | 649745 | -12 |
Is there a chance to create a report containing just the rows with a negative marginal return?
My other question ist about zero values in rows.
Let's assume we've got the following Chart in QlikView:
| Client | Article | Amount 2015 | Amount 2014 | Value 2015 | Value 2014 |
|---|---|---|---|---|---|
| Client A | 4545 | 12 | 17 | 100 | 120 |
| Client A | 7845 | 0 | 10 | 0 | 50 |
| Client B | 1245 | 7 | 15 | 45 | 90 |
| Client C | 1546 | 10 | 15 | 45 | 60 |
| Client D | 7845 | 0 | 45 | 0 | 90 |
| Client E | 8789 | 0 | 13 | 0 | 47 |
Exporting this Chart with NPrinting, but just displayin the current year ends up in some zero values in this report:
| Client | Article | Amount 2015 | Value 2015 |
|---|---|---|---|
| Client A | 4545 | 12 | 100 |
| Client A | 7845 | 0 | 0 |
| Client B | 1245 | 7 | 45 |
| Client C | 1546 | 10 | 45 |
| Client D | 7845 | 0 | 0 |
| Client E | 8789 | 0 | 0 |
Is there a chance exporting this chart via NPrinting dissregarding rows with zero values after not displaying all columns?
Thanks in advance!
Patrick
- Mark as New
- Bookmark
- Subscribe
- Mute
- Subscribe to RSS Feed
- Permalink
- Report Inappropriate Content
Hi Patrik,
You can create and use NPrinting field filters to achieve this. NPrinting supports Advanced Search like filters.
I have attached a small project that does what you want. Please extract to folder C:\Temp\Community\003\ in order to preserve the paths used or you will need to change the paths for the connection and report templates within the NPrinting project.
These are the filters I created:
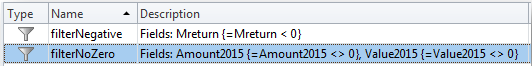
HTH - Daniel.
- Mark as New
- Bookmark
- Subscribe
- Mute
- Subscribe to RSS Feed
- Permalink
- Report Inappropriate Content
Great!
Thank you very much!
Patrick
- Mark as New
- Bookmark
- Subscribe
- Mute
- Subscribe to RSS Feed
- Permalink
- Report Inappropriate Content
I'm afraid there is one more thing.
In reality those values are no dimensions, but expressions.
I just found a way to filter dimensions, is there a way to filter those expressed values?
Thanks in advance,
Patrick
- Mark as New
- Bookmark
- Subscribe
- Mute
- Subscribe to RSS Feed
- Permalink
- Report Inappropriate Content
Hi Patrik,
I have added a chart with expressions and filtered on one of them. Please see attached.
You can also filter on QlikView bookmarks.
HTH - Daniel.
- Mark as New
- Bookmark
- Subscribe
- Mute
- Subscribe to RSS Feed
- Permalink
- Report Inappropriate Content
Sorry for my late response,
I'm testing your solution right now, but there seems to be a problem adepting it to my application.
But for now: Am I getting it right, that the person building the reports would need to have knowledge of the expressions of a specific chart to take advance of the filters for reducing the data as mentioned?
I'll let you know as soon as I know more about my having problems adepting the filter.
I thought using the expression would dolve the problem.
Assuming "Expression1" is my Expression calculating the relative profit, I used the following filter for just displaying the negative profit:
=if(Expression1 < 0, Expression1)
This takes ages to calculate and in the end i have a result showing other values than my chart in QV, also it still shows positive profit.
But I'll try little bit more and write again as soon as I know more.