Unlock a world of possibilities! Login now and discover the exclusive benefits awaiting you.
- Qlik Community
- :
- All Forums
- :
- QlikView App Dev
- :
- how to show growth percentage year on year in line...
Options
- Subscribe to RSS Feed
- Mark Topic as New
- Mark Topic as Read
- Float this Topic for Current User
- Bookmark
- Subscribe
- Mute
- Printer Friendly Page
Turn on suggestions
Auto-suggest helps you quickly narrow down your search results by suggesting possible matches as you type.
Showing results for
Not applicable
2015-06-28
09:55 AM
- Mark as New
- Bookmark
- Subscribe
- Mute
- Subscribe to RSS Feed
- Permalink
- Report Inappropriate Content
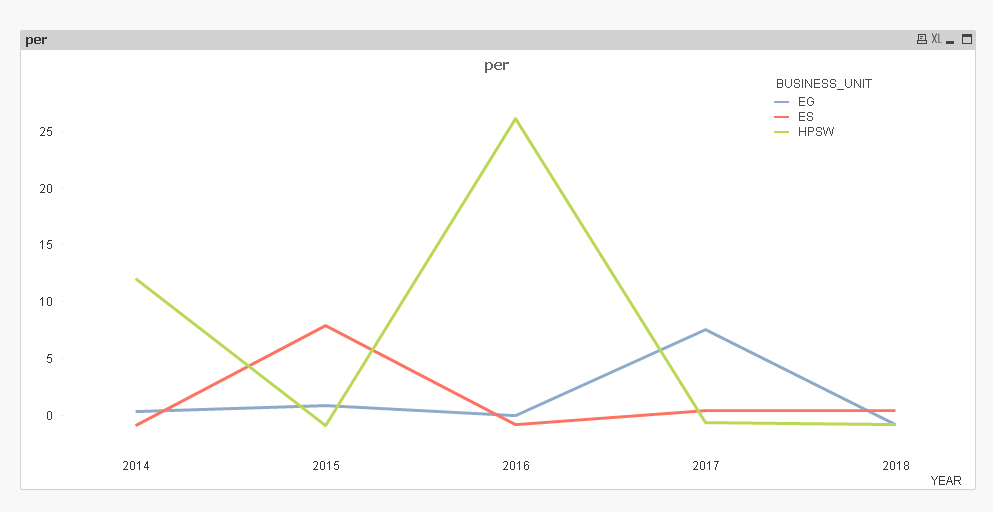
how to show growth percentage year on year in line chart
Hi Friends,
Please find the attached QVW. How to show growth or decrements on year year --BUSINESS_UNIT wise..
sunindia !
1,106 Views
1 Solution
Accepted Solutions
MVP
2015-06-28
10:12 AM
- Mark as New
- Bookmark
- Subscribe
- Mute
- Subscribe to RSS Feed
- Permalink
- Report Inappropriate Content
546 Views
7 Replies
MVP
2015-06-28
10:12 AM
- Mark as New
- Bookmark
- Subscribe
- Mute
- Subscribe to RSS Feed
- Permalink
- Report Inappropriate Content
check this out (PFA)
Sunny
547 Views
Not applicable
2015-06-28
01:03 PM
Author
- Mark as New
- Bookmark
- Subscribe
- Mute
- Subscribe to RSS Feed
- Permalink
- Report Inappropriate Content
Hi ,
It is working. Thank you so much.
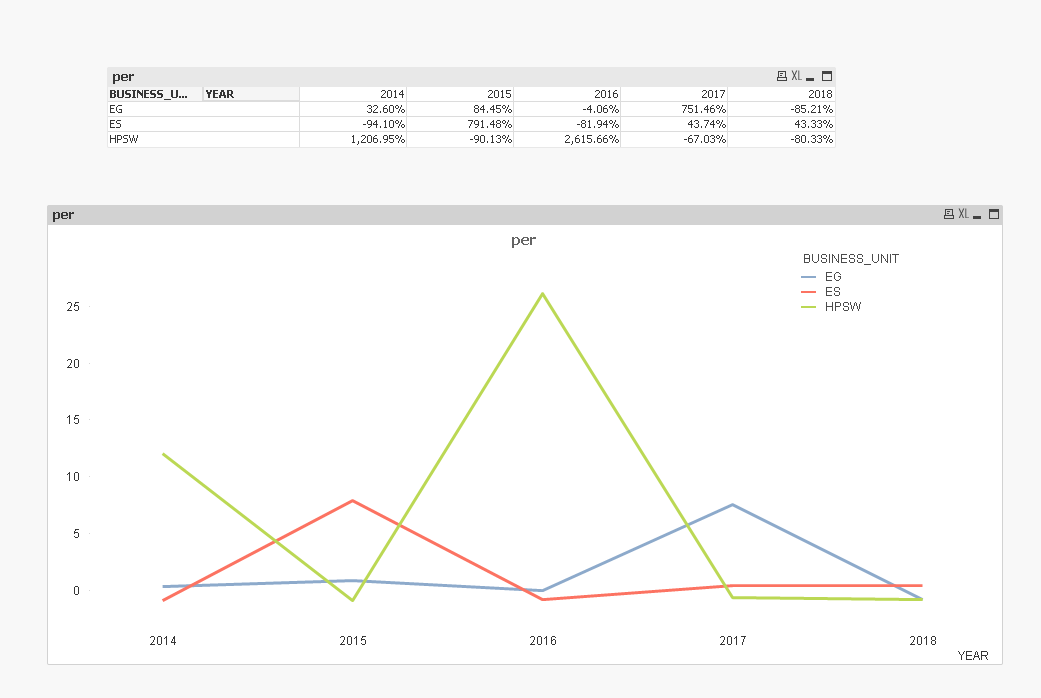
I would like to display these same values in pivot table instead of values ,i need growth percentage.
| Business Group | 2015 ($ M) | 2016 ($ M) | 2017 ($ M) | 2018 ($ M) | |
| EG | 105,994.26 | 109,791.99 | 112,809.03 | 115,867.73 | |
| ES | 366,339.73 | 381,554.07 | 393,803.69 | 412,669.51 | |
| HPSW | 27,920.72 | 29,777.91 | 31,365.53 | 33,811.88 |
546 Views
Not applicable
2015-06-28
01:13 PM
Author
- Mark as New
- Bookmark
- Subscribe
- Mute
- Subscribe to RSS Feed
- Permalink
- Report Inappropriate Content
Hi Tulsi
Pls find the attached file
546 Views
Not applicable
2015-06-28
01:23 PM
Author
- Mark as New
- Bookmark
- Subscribe
- Mute
- Subscribe to RSS Feed
- Permalink
- Report Inappropriate Content
Hi Senthil,
I would like to show same as above table YEAR in TOP row.. I am not getting. Can you please check once
546 Views
MVP
2015-06-28
01:40 PM
- Mark as New
- Bookmark
- Subscribe
- Mute
- Subscribe to RSS Feed
- Permalink
- Report Inappropriate Content
This?
Not applicable
2015-06-28
01:47 PM
Author
- Mark as New
- Bookmark
- Subscribe
- Mute
- Subscribe to RSS Feed
- Permalink
- Report Inappropriate Content
Hi ,
It is working. Thank you so much.
546 Views
Not applicable
2015-06-30
05:57 AM
Author
- Mark as New
- Bookmark
- Subscribe
- Mute
- Subscribe to RSS Feed
- Permalink
- Report Inappropriate Content
546 Views