Unlock a world of possibilities! Login now and discover the exclusive benefits awaiting you.
- Qlik Community
- :
- All Forums
- :
- QlikView App Dev
- :
- Tooltip in Linear gauge
- Subscribe to RSS Feed
- Mark Topic as New
- Mark Topic as Read
- Float this Topic for Current User
- Bookmark
- Subscribe
- Mute
- Printer Friendly Page
- Mark as New
- Bookmark
- Subscribe
- Mute
- Subscribe to RSS Feed
- Permalink
- Report Inappropriate Content
Tooltip in Linear gauge
Hi All,
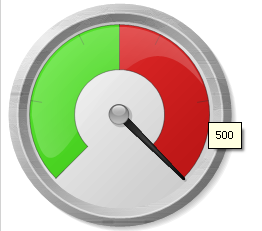
i am using linear gauge in a straight table , in the gauge setting i have created two segments and distinguishing them by different colors. The lower bound of segment 2 is showing the average value.
1. How to add tooltip for this average value ?
2. How to add tooltip for the needle (needle is showing actual value)?
Thanks.
Regards,
Nishith
- Tags:
- new_to_qlikview
- « Previous Replies
-
- 1
- 2
- Next Replies »
- Mark as New
- Bookmark
- Subscribe
- Mute
- Subscribe to RSS Feed
- Permalink
- Report Inappropriate Content
see this examples
- Mark as New
- Bookmark
- Subscribe
- Mute
- Subscribe to RSS Feed
- Permalink
- Report Inappropriate Content
Thanks Enrique . I get that I need to check on pop-up labels. But in linear gauge used inside a straight table , surprisingly I am not able to check pop up label button.
The examples which are posted above are examples of individual chart types. I am not able to select pop ub labels option in linear gause used inside a straight table chart.
Hope I have made the query clear.
Thanks
- Mark as New
- Bookmark
- Subscribe
- Mute
- Subscribe to RSS Feed
- Permalink
- Report Inappropriate Content
You could add another column to show the gauge value.
- Mark as New
- Bookmark
- Subscribe
- Mute
- Subscribe to RSS Feed
- Permalink
- Report Inappropriate Content
Hi Nitish,
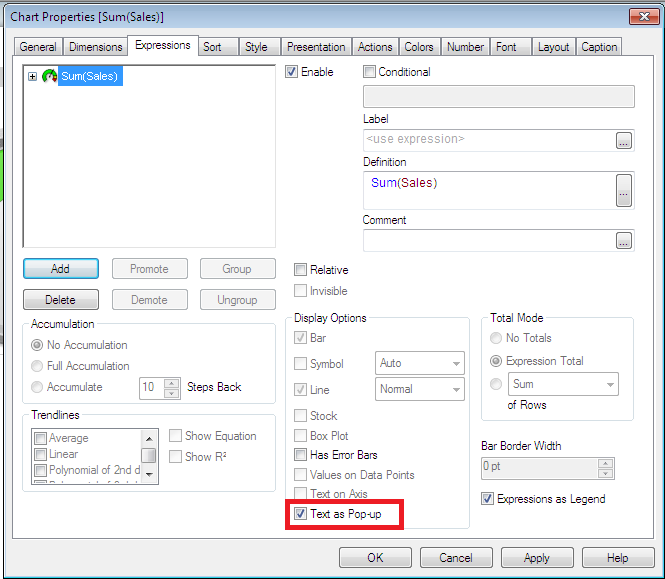
The pop-up should active by default. If it is not try like this
Goto expression tab and check the Text as pop-up now you will get the value in pop-up.
Regards,
Nandha
- Mark as New
- Bookmark
- Subscribe
- Mute
- Subscribe to RSS Feed
- Permalink
- Report Inappropriate Content
Hi Nandhakumar,
can you send me screenshot where I can get text as pop-up option in straight table chart.
Hi Sindhu ,
Please elaborate your solution with steps if possible.
- Mark as New
- Bookmark
- Subscribe
- Mute
- Subscribe to RSS Feed
- Permalink
- Report Inappropriate Content
Hi ,
I found another thread with same query which is not answered.
How to display the expression value when hovering over a traffic light gauge in a straight table?
- Mark as New
- Bookmark
- Subscribe
- Mute
- Subscribe to RSS Feed
- Permalink
- Report Inappropriate Content
Are you looking for this
Then try this
Sindhu asking you to create a text object and show the value in that.
- Mark as New
- Bookmark
- Subscribe
- Mute
- Subscribe to RSS Feed
- Permalink
- Report Inappropriate Content
Hi ,
No I am looking to use linear gauge in straight table chart. The option which you have shown is for a gauge chart specifically.
I am using straight table chart , inside which you can show expressions using different types of traffic lights , linear gauge etc.
Thanks.
- Mark as New
- Bookmark
- Subscribe
- Mute
- Subscribe to RSS Feed
- Permalink
- Report Inappropriate Content
Can you pls attach your application?
Regards,
Nandha
- « Previous Replies
-
- 1
- 2
- Next Replies »