Unlock a world of possibilities! Login now and discover the exclusive benefits awaiting you.
- Qlik Community
- :
- All Forums
- :
- QlikView App Dev
- :
- How can I do this example of Calculation Condition...
- Subscribe to RSS Feed
- Mark Topic as New
- Mark Topic as Read
- Float this Topic for Current User
- Bookmark
- Subscribe
- Mute
- Printer Friendly Page
- Mark as New
- Bookmark
- Subscribe
- Mute
- Subscribe to RSS Feed
- Permalink
- Report Inappropriate Content
How can I do this example of Calculation Condition in the Line Chart?
Hi all,
I have the following example of a Line Chart in QlikView:
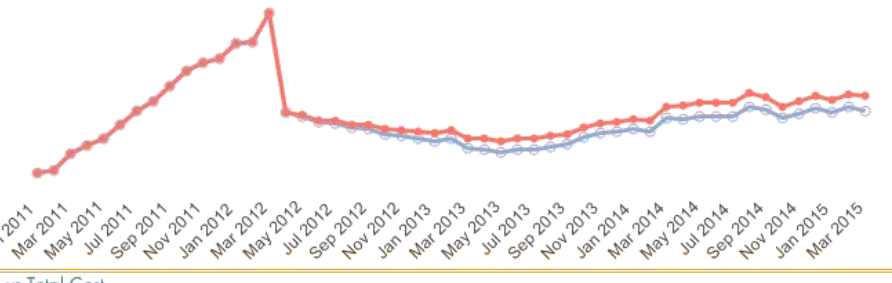
The two lines represent a Yes or No trend based on two expressions.
I want to put a calculation in each of these expressions so that when a user selects Yes in a List Box it shows just that line. Or if they select No it only shows that line. Or if they select both Yes and No in the List Box it should show both lines.
Does anyone know how I can implement something like this?
The Yes/No values in a List Box are independent of the expressions (i.e. they are not actually used in the expression).
Please share your thoughts 
- Mark as New
- Bookmark
- Subscribe
- Mute
- Subscribe to RSS Feed
- Permalink
- Report Inappropriate Content
Can you provide the relation of Yes/No with these expressions?
You can have Conditional Show of both Expression
Considering your FieldName of Yes/No is YN
Expression Tab
For 1st Expression
GetFieldSelections(YN)='YES'
For 2nd Expression
GetFieldSelections(YN)='NO'
- Mark as New
- Bookmark
- Subscribe
- Mute
- Subscribe to RSS Feed
- Permalink
- Report Inappropriate Content
Have you considered using conditional expressions?
Something like
=index(Concat(YesNoListBoxField),'Y')
resp.
=index(Concat(YesNoListBoxField),'N')
assuming a list box showing Yes / No values.
- Mark as New
- Bookmark
- Subscribe
- Mute
- Subscribe to RSS Feed
- Permalink
- Report Inappropriate Content
Hi Manish,
I tried to do exactly this but I get "All expressions disabled" message when I select both Yes and No in the List Box.
It works when I have one value selected but not both.
Any ideas how to show both values in the graph?
- Mark as New
- Bookmark
- Subscribe
- Mute
- Subscribe to RSS Feed
- Permalink
- Report Inappropriate Content
Hi swuehl,
Would this be applied to each of the expression using the Conditional option above the Expression field?
- Mark as New
- Bookmark
- Subscribe
- Mute
- Subscribe to RSS Feed
- Permalink
- Report Inappropriate Content
Yes, these should be used as conditional expressions.