Unlock a world of possibilities! Login now and discover the exclusive benefits awaiting you.
- Qlik Community
- :
- Forums
- :
- Analytics
- :
- App Development
- :
- Aggr and set analysis
- Subscribe to RSS Feed
- Mark Topic as New
- Mark Topic as Read
- Float this Topic for Current User
- Bookmark
- Subscribe
- Mute
- Printer Friendly Page
- Mark as New
- Bookmark
- Subscribe
- Mute
- Subscribe to RSS Feed
- Permalink
- Report Inappropriate Content
Aggr and set analysis
I have been trying to figure out a way to get the measure that I need for my pivot table without creating a new field in the load script. I was hoping to accomplish this via the AGGR function and set analysis.
What I'm trying to do is Sum(IDCount) where the earliest accounting date falls between a starting and ending date. Consider the following sample data:
| ID | Division | Branch | AccountingDate | IDCount |
| 1 | 1 | 2 | 6/1/2015 | 1 |
| 1 | 1 | 2 | 6/10/2015 | 1 |
| 2 | 1 | 2 | 4/1/2015 | 1 |
| 2 | 1 | 2 | 6/12/2015 | 1 |
| 3 | 1 | 2 | 6/15/2015 | 1 |
| 3 | 1 | 2 | 6/18/2015 | 1 |
| 4 | 1 | 3 | 6/2/2015 | 1 |
| 5 | 1 | 3 | 3/25/2015 | 1 |
If my starting date is 6/1/2015 and my ending date is 6/30/2015, I expect three rows to match my criteria (highlighted in yellow). I would like to use this measure in a pivot table that has the dimensions of Division and Branch. I would like to display the following:
| Division | Branch | Total |
| 1 | 2 | 2 |
| 1 | 3 | 1 |
Thinking in set analysis mode, I would like to do the following:
Sum({1<Min([AccountingDate])={">=$(=Date($(v3)))<=$(=Date($(v4)))"}>}[IDCount])
However, this is not possible. I was thinking that if I could use AGGR, it may be possible. Something like:
Sum({1<Aggr(Min([AccountingDate]), [Division], [Branch], [ID])={">=$(=Date($(v3)))<=$(=Date($(v4)))"}>}[IDCount])
Is this possible? Anyone have any suggestions as to how this can be achieved? Not sure if I can apply set analysis over the field that is being aggregated.
Thanks.
Kevin
- Mark as New
- Bookmark
- Subscribe
- Mute
- Subscribe to RSS Feed
- Permalink
- Report Inappropriate Content
Hi Kevin,
I had to do a small trick to get this working.
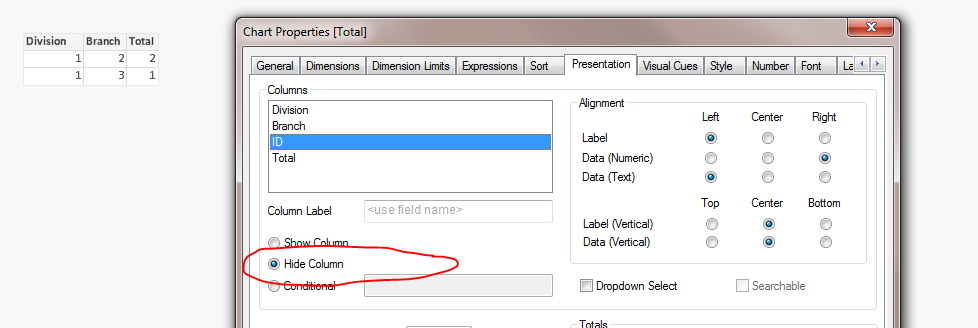
I brought in Division, Branch, and ID dimensions first:

Then in the presentation tab, I hid the ID dimension:
Lastly, I used the below expression to come up with your desired results.
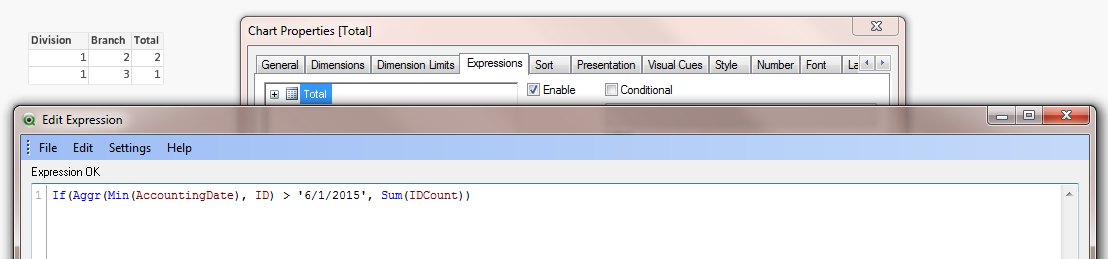
Hope this helps.
- Mark as New
- Bookmark
- Subscribe
- Mute
- Subscribe to RSS Feed
- Permalink
- Report Inappropriate Content
Sinan,
Unfortunately, your solution is using Qlik View. I am using Qlik Sense and do not the option to hide a dimension/column. I will look at trying to use your expression with hopes that it points me in a new direction.
- Mark as New
- Bookmark
- Subscribe
- Mute
- Subscribe to RSS Feed
- Permalink
- Report Inappropriate Content
Hi Kevin,
I have just realized that your requirements were different than what I interpreted so the above solution won't work.
Sorry, I will try to rectify it.
Thanks
- Mark as New
- Bookmark
- Subscribe
- Mute
- Subscribe to RSS Feed
- Permalink
- Report Inappropriate Content
Anyway, it is not a good solution for QlikView either.
I will try to come up with a better expression.
- Mark as New
- Bookmark
- Subscribe
- Mute
- Subscribe to RSS Feed
- Permalink
- Report Inappropriate Content
Hi Kevin,
Did you have any luck with this?
I was thinking of a set analysis like the below:
Sum({<AccountingDate = {">=$(=Aggr(Min(AccountingDate), ID, Branch))<$(=Aggr(Max(AccountingDate), ID, Branch))"}>} IDCount)
If this doesn't work, then unfortunately you may have to create Min and Max dates in your load script.
Thanks
- Mark as New
- Bookmark
- Subscribe
- Mute
- Subscribe to RSS Feed
- Permalink
- Report Inappropriate Content
Sinan,
I don't believe that this will work either. The minimum Accounting Date must fall between two dates that are variables. 
I appreciate your help. As you said, it may be easier just to add the date in the load script. I was trying to avoid this as the measure I am trying to create will probably never be used again other than on this pivot table.
Thanks again for your help.
Kevin
- Mark as New
- Bookmark
- Subscribe
- Mute
- Subscribe to RSS Feed
- Permalink
- Report Inappropriate Content
Let me know if you come with a solution that doesn't require creating additional dimensions in the load script.
Thanks