Unlock a world of possibilities! Login now and discover the exclusive benefits awaiting you.
- Qlik Community
- :
- Forums
- :
- Analytics
- :
- New to Qlik Analytics
- :
- Qlik Sense 2 Dimension Stacked Bar Chart
- Subscribe to RSS Feed
- Mark Topic as New
- Mark Topic as Read
- Float this Topic for Current User
- Bookmark
- Subscribe
- Mute
- Printer Friendly Page
- Mark as New
- Bookmark
- Subscribe
- Mute
- Subscribe to RSS Feed
- Permalink
- Report Inappropriate Content
Qlik Sense 2 Dimension Stacked Bar Chart
New to Sense...
Have a Stacked bar chart with 2 dimensions and 1 expression
Dimension 1 is hour, Dimension 2 is ID
The top portion of the stacked bars contains a grey "striped" section (see attached).
Can you help me understand what I am seeing here and perhaps how to remove (if appropriate)
Thank You 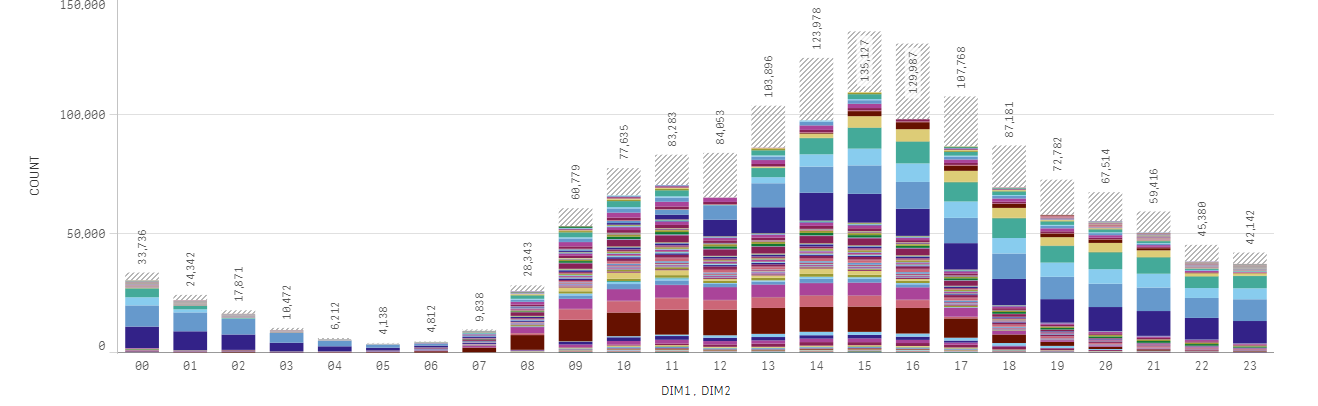
- Mark as New
- Bookmark
- Subscribe
- Mute
- Subscribe to RSS Feed
- Permalink
- Report Inappropriate Content
Hi,
Exceeding the numbers of values graphically representable for your DIM2 dimension ?
You can test i by add a lot of new value and see what happens.
- Mark as New
- Bookmark
- Subscribe
- Mute
- Subscribe to RSS Feed
- Permalink
- Report Inappropriate Content
Hi Glenn,
These are most likely null or blank values in DIM2. You can suppress these by editing the chart and on the right hand pane under data then DIM2 uncheck the box "Show null values".
Hope this helps.
Rod