Unlock a world of possibilities! Login now and discover the exclusive benefits awaiting you.
- Qlik Community
- :
- Forums
- :
- Analytics
- :
- New to Qlik Analytics
- :
- How do you change the Scale of a Bar Chart
- Subscribe to RSS Feed
- Mark Topic as New
- Mark Topic as Read
- Float this Topic for Current User
- Bookmark
- Subscribe
- Mute
- Printer Friendly Page
- Mark as New
- Bookmark
- Subscribe
- Mute
- Subscribe to RSS Feed
- Permalink
- Report Inappropriate Content
How do you change the Scale of a Bar Chart
Lets say that your required to convert some existing dashboards to be displayed using Qlik Sense. One of the bar charts in question is displaying a Fill rate % by day which typically runs in the 98-100% range every day and has never gone below say 90%. The scale for the attached "original" shows a scale from 85% to 105%. How would this be accomplished using Qlik? Please see the attached images.
Accepted Solutions
- Mark as New
- Bookmark
- Subscribe
- Mute
- Subscribe to RSS Feed
- Permalink
- Report Inappropriate Content
Hi Kenneth,
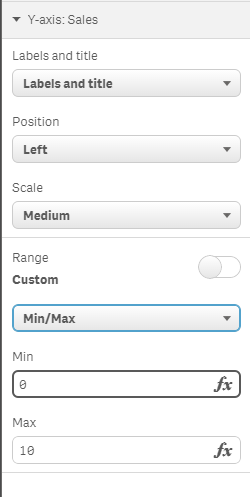
In the Chart Properties, under Appearance>Y-Axis, find the setting Range and set a Custom range instead of the default Automatic range.
Cheers,
Oleg Troyansky
QlikView Your Business: An expert guide to Business Discovery with QlikView and Qlik Sense
- Mark as New
- Bookmark
- Subscribe
- Mute
- Subscribe to RSS Feed
- Permalink
- Report Inappropriate Content
Hi Kenneth,
In the Chart Properties, under Appearance>Y-Axis, find the setting Range and set a Custom range instead of the default Automatic range.
Cheers,
Oleg Troyansky
QlikView Your Business: An expert guide to Business Discovery with QlikView and Qlik Sense