Unlock a world of possibilities! Login now and discover the exclusive benefits awaiting you.
- Qlik Community
- :
- All Forums
- :
- QlikView App Dev
- :
- Dimension as label in bar chart
- Subscribe to RSS Feed
- Mark Topic as New
- Mark Topic as Read
- Float this Topic for Current User
- Bookmark
- Subscribe
- Mute
- Printer Friendly Page
- Mark as New
- Bookmark
- Subscribe
- Mute
- Subscribe to RSS Feed
- Permalink
- Report Inappropriate Content
Dimension as label in bar chart
I want to show a dimension as a label in a bar chart, without showing it as a legend or an axis. How do I do this?
- « Previous Replies
-
- 1
- 2
- Next Replies »
Accepted Solutions
- Mark as New
- Bookmark
- Subscribe
- Mute
- Subscribe to RSS Feed
- Permalink
- Report Inappropriate Content
found the solution. Thx for everyone help!
- Mark as New
- Bookmark
- Subscribe
- Mute
- Subscribe to RSS Feed
- Permalink
- Report Inappropriate Content
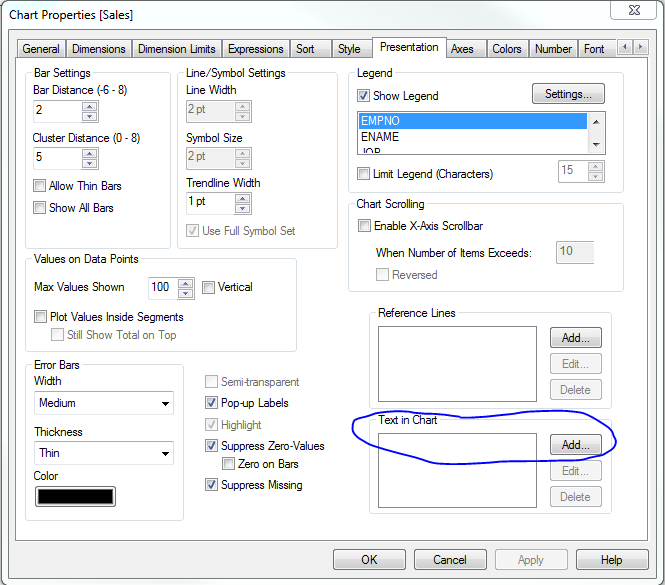
Use Text in Chart option
- Mark as New
- Bookmark
- Subscribe
- Mute
- Subscribe to RSS Feed
- Permalink
- Report Inappropriate Content
Hi- that's not working. I'm trying to add a calculated dimension
- Mark as New
- Bookmark
- Subscribe
- Mute
- Subscribe to RSS Feed
- Permalink
- Report Inappropriate Content
go to presentation tab and add text in chart
- Mark as New
- Bookmark
- Subscribe
- Mute
- Subscribe to RSS Feed
- Permalink
- Report Inappropriate Content
That's what I did
- Mark as New
- Bookmark
- Subscribe
- Mute
- Subscribe to RSS Feed
- Permalink
- Report Inappropriate Content
still you dint get?
- Mark as New
- Bookmark
- Subscribe
- Mute
- Subscribe to RSS Feed
- Permalink
- Report Inappropriate Content
Uncheck Show Legend and and Label in Dimension
and hard code the names in Presentation > Add Text
using Ctrl+Shift you can move these texts where ever you want
- Mark as New
- Bookmark
- Subscribe
- Mute
- Subscribe to RSS Feed
- Permalink
- Report Inappropriate Content
Hi this is an example of what I'm trying to do. On the bars I want to show the result of
if(rule2='blank',rule,rule2)
- Mark as New
- Bookmark
- Subscribe
- Mute
- Subscribe to RSS Feed
- Permalink
- Report Inappropriate Content
HI madelein
maybe check "Plot Values Inside Segment" in Presentation Property (tick this check box)
Regards,
gireesh
- Mark as New
- Bookmark
- Subscribe
- Mute
- Subscribe to RSS Feed
- Permalink
- Report Inappropriate Content
Hope this will help you
Example:
1. Create a pie chart with Country as the dimension. Add the following expressio n:
=Dual(
if(Len(Only(Country))>0, Country, 'Others')
& chr(10) & Num(Sum(Sales), '#,##0')
,Sum(Sales)
)
2. On the Expression tab, label the expression as Sales $ and turn on the
Values on Data Points option.
3. On the Sort tab, turn on the Y-Value option.
4. On the Presentation tab, turn off the Show Legend option.
5. On the Numbers tab, ensure that Expression Default is selected.
6. Click on OK to save the chart. Note that the country names and values
are displayed besides each segment.
- « Previous Replies
-
- 1
- 2
- Next Replies »