Unlock a world of possibilities! Login now and discover the exclusive benefits awaiting you.
- Qlik Community
- :
- All Forums
- :
- QlikView App Dev
- :
- How to convert my existing Table to chart ?
- Subscribe to RSS Feed
- Mark Topic as New
- Mark Topic as Read
- Float this Topic for Current User
- Bookmark
- Subscribe
- Mute
- Printer Friendly Page
- Mark as New
- Bookmark
- Subscribe
- Mute
- Subscribe to RSS Feed
- Permalink
- Report Inappropriate Content
How to convert my existing Table to chart ?
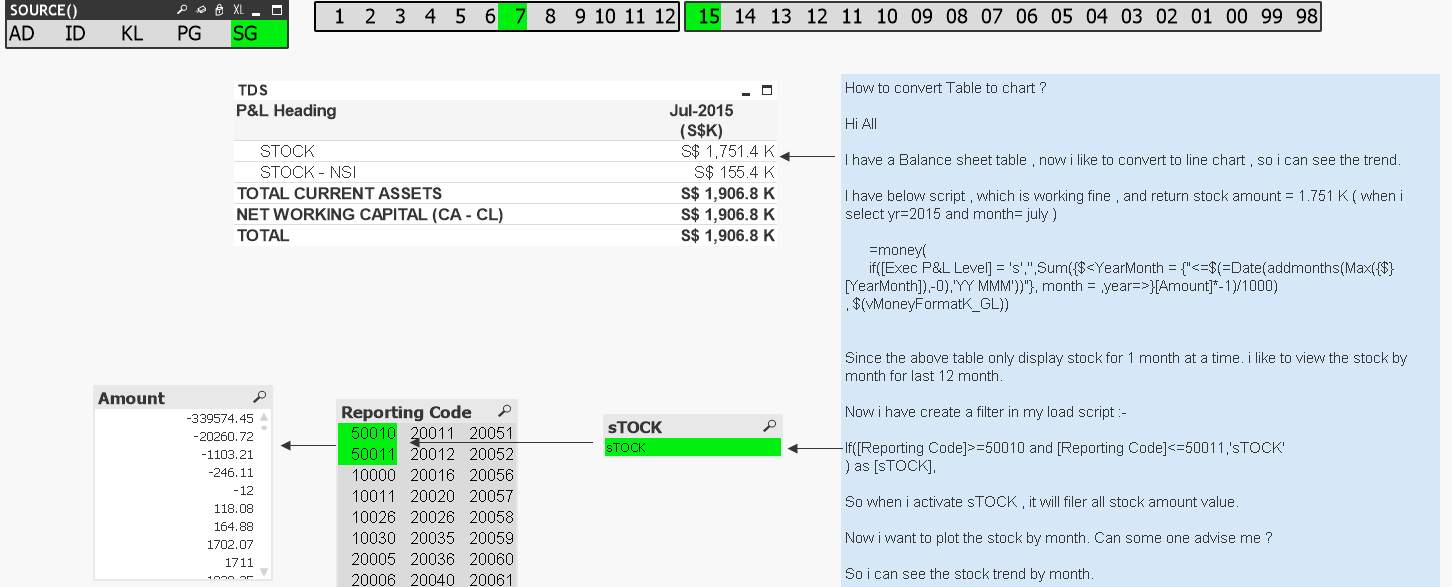
How to convert Table to chart ?
Hi All
I have a Balance sheet table , now i like to convert to line chart , so i can see the trend.
I have below script , which is working fine , and return stock amount = 1.751 K ( when i select yr=2015 and month= july )
=money(
if([Exec P&L Level] = 's','',Sum({$<YearMonth = {"<=$(=Date(addmonths(Max({$}[YearMonth]),-0),'YY MMM'))"}, month = ,year=>}[Amount]*-1)/1000)
, $(vMoneyFormatK_GL))
Since the above table only display stock for 1 month at a time. i like to view the stock by month for last 12 month.
Now i have create a filter in my load script :-
If([Reporting Code]>=50010 and [Reporting Code]<=50011,'sTOCK'
) as [sTOCK],
So when i activate sTOCK , it will filer all stock amount value.
Now i want to plot the stock by month. Can some one advise me ?
So i can see the stock trend by month.
Paul
- Tags:
- qlikview_scripting