Unlock a world of possibilities! Login now and discover the exclusive benefits awaiting you.
- Qlik Community
- :
- All Forums
- :
- QlikView App Dev
- :
- How to adjust pie chart and bar chart positions
- Subscribe to RSS Feed
- Mark Topic as New
- Mark Topic as Read
- Float this Topic for Current User
- Bookmark
- Subscribe
- Mute
- Printer Friendly Page
- Mark as New
- Bookmark
- Subscribe
- Mute
- Subscribe to RSS Feed
- Permalink
- Report Inappropriate Content
How to adjust pie chart and bar chart positions
Hi to everyone, i got a question about a problem i've faced with.
I have 3 elements to be layout: pie chart, bar chart and table. All of them have columns which are supposed to be sharply under each other just like on the picture below.
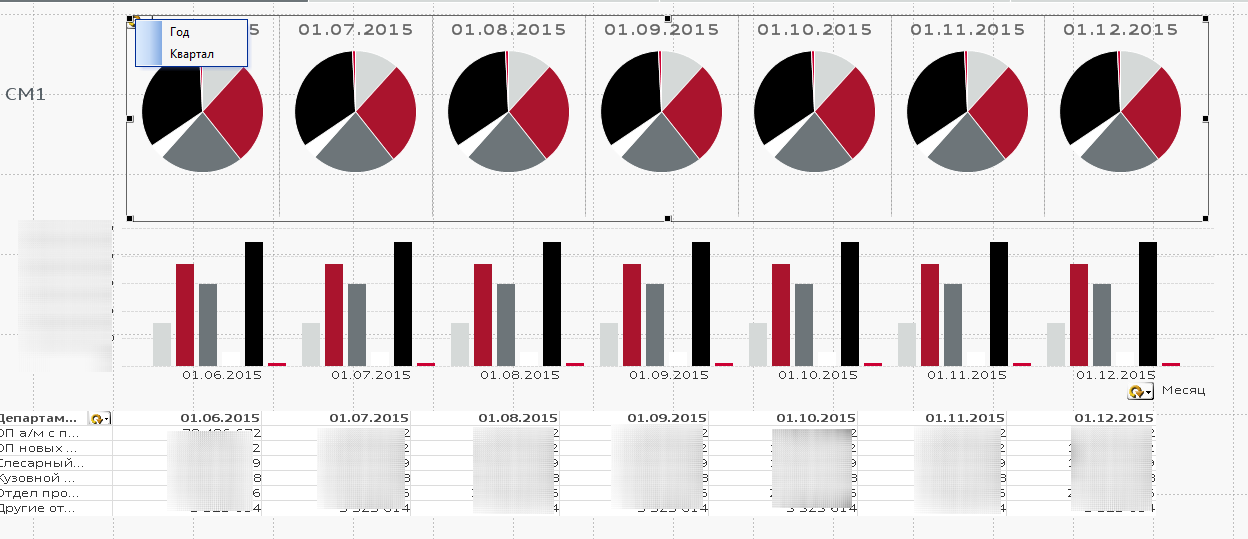
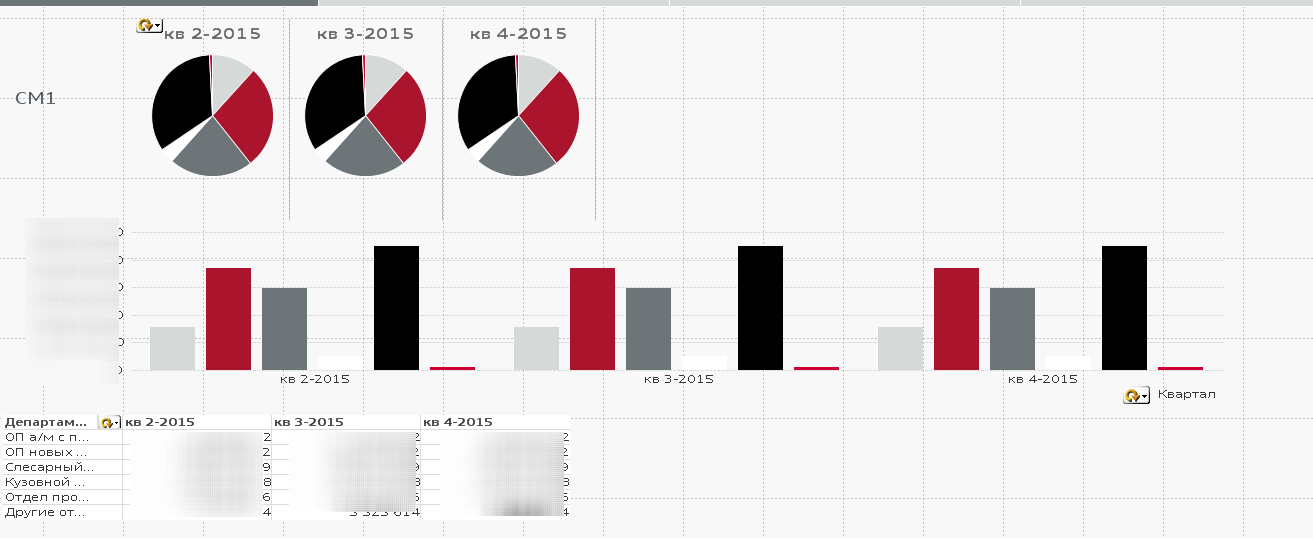
But when i change a dimension in a cycle group from MONTH to QUARTER charts dont look like this any longer.
1. How to adjust table columns width every time I change a dimension?
2, How to make a horizontal scrolling bar in pie chart in case there are more than 6 months chosed. Now it is a vertical scrolling bar.
- Mark as New
- Bookmark
- Subscribe
- Mute
- Subscribe to RSS Feed
- Permalink
- Report Inappropriate Content
You tried to use the stacked version of the bar chart?
I am not sure you can achive what you want like described above...
Patric
- Mark as New
- Bookmark
- Subscribe
- Mute
- Subscribe to RSS Feed
- Permalink
- Report Inappropriate Content
No its not stacked at all
- Mark as New
- Bookmark
- Subscribe
- Mute
- Subscribe to RSS Feed
- Permalink
- Report Inappropriate Content
It looks like the pie and table are still aligned but the bar chart is the issue - try using a stacked version of the chart
what about putting the objects in containers for formatting and alignment
are you using terllis?
can you provide a qvw?
are you formatting your bar chart object differently - your other objects are resizing to a smaller area but the bar chart, even with only 3 dimensions values are taking up the same space as when there were 7
- Mark as New
- Bookmark
- Subscribe
- Mute
- Subscribe to RSS Feed
- Permalink
- Report Inappropriate Content
recycle1 I dont know how to attach the qvw. Would be great to give you that piece for a help)