Unlock a world of possibilities! Login now and discover the exclusive benefits awaiting you.
- Qlik Community
- :
- All Forums
- :
- QlikView App Dev
- :
- Conditional Statements to highlight shell for a Pi...
- Subscribe to RSS Feed
- Mark Topic as New
- Mark Topic as Read
- Float this Topic for Current User
- Bookmark
- Subscribe
- Mute
- Printer Friendly Page
- Mark as New
- Bookmark
- Subscribe
- Mute
- Subscribe to RSS Feed
- Permalink
- Report Inappropriate Content
Conditional Statements to highlight shell for a Pivot Table in Qlik Sense
Hi All,
I am new to Qlik Sense and i am trying to build some reports. I could able to do all my reports on my its own with little help of documentation but i am stuck in one report.
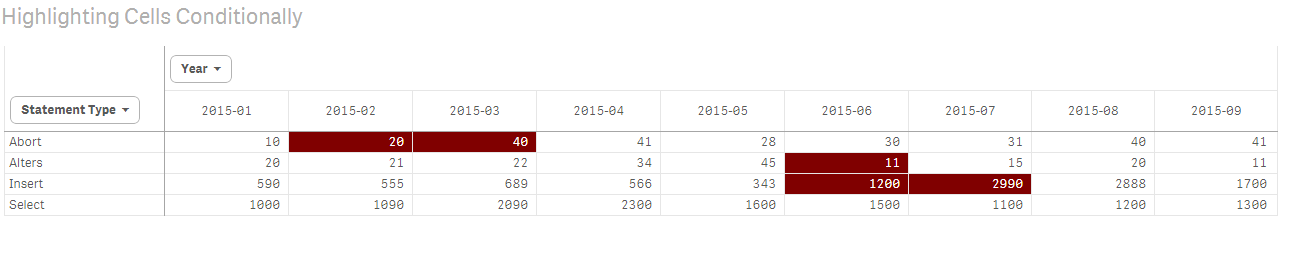
I have built a Pivot table which has Row and Columns as below tables and measure is count of statements for that month.
I would like to highlight all the shells in RED if count has increased or decreased more than 50% compared to previous month.
Example: Abort statement
Jan: count was 10
Feb : Count was 20
So i would like to highlight 20 as red. Similarly it should check all the shell
| Statement Type | 2015-01 | 2015-02 | 2015-03 | 2015-04 | 2015-05 | 2015-06 | 2015-07 | 2015-08 | 2015-09 |
|---|---|---|---|---|---|---|---|---|---|
| Abort | 10 | 20 | 40 | 41 | 28 | 30 | 31 | 40 | 41 |
| Alters | 20 | 21 | 22 | 34 | 45 | 11 | 15 | 20 | 11 |
| Select | 1000 | 1090 | 2090 | 2300 | 1600 | 1500 | 1100 | 1200 | 1300 |
| Insert | 590 | 555 | 689 | 566 | 343 | 1200 | 2990 | 2888 | 1700 |
-Sam
- Mark as New
- Bookmark
- Subscribe
- Mute
- Subscribe to RSS Feed
- Permalink
- Report Inappropriate Content
Hi Sam,
Let me know if this is what you are looking for:
I am attaching the example app as well.
Hope this helps.
Thanks
- Mark as New
- Bookmark
- Subscribe
- Mute
- Subscribe to RSS Feed
- Permalink
- Report Inappropriate Content
Sinan,
Its perfect. Before did the trick 
Thank you.