Unlock a world of possibilities! Login now and discover the exclusive benefits awaiting you.
- Qlik Community
- :
- All Forums
- :
- QlikView App Dev
- :
- DATA POINT VALUES COUNT MUST BE EQUAL TO 100%
- Subscribe to RSS Feed
- Mark Topic as New
- Mark Topic as Read
- Float this Topic for Current User
- Bookmark
- Subscribe
- Mute
- Printer Friendly Page
- Mark as New
- Bookmark
- Subscribe
- Mute
- Subscribe to RSS Feed
- Permalink
- Report Inappropriate Content
DATA POINT VALUES COUNT MUST BE EQUAL TO 100%
Hi Team,
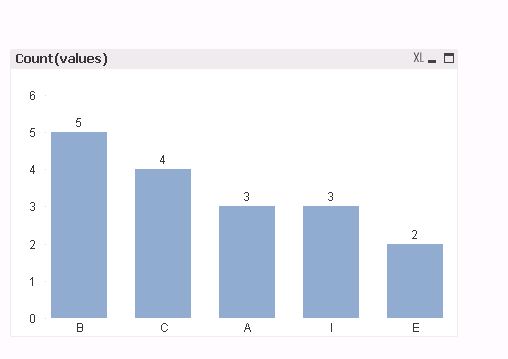
I created a bar chart for top 5 names in my scenario by taking count of values. ! In the below image u can see the values for B=5,C=4,A=3,I=3,E=2. but what I need is that values should be displayed in percentages like B=29%,C=23%,A=18%,I=18%,E=12% i.e equal to 100%. And one thing is in my case there will be lot of names but i need to take only top 5 and that to be represent in percentages.
I am also attaching sample excel sheet to understand clearly .
please help me in this
Thanks in advance
Regards,
chinnu.
- Tags:
- new_to_qlikview
- « Previous Replies
-
- 1
- 2
- Next Replies »
Accepted Solutions
- Mark as New
- Bookmark
- Subscribe
- Mute
- Subscribe to RSS Feed
- Permalink
- Report Inappropriate Content
Try this expression:
=If(Count(values) > 0,
Count({<Names = {"=Only({<Names = >}Aggr(NODISTINCT Rank(Count({<Names = >} values), 0, 1), Names)) < 6"}>} values)/
Count(TOTAL{<Names = {"=Only({<Names = >}Aggr(NODISTINCT Rank(Count({<Names = >} values), 0, 1), Names)) < 6"}>} values))
- Mark as New
- Bookmark
- Subscribe
- Mute
- Subscribe to RSS Feed
- Permalink
- Report Inappropriate Content
As per your data D and E both have count of 2. How you choose E between the two??
- Mark as New
- Bookmark
- Subscribe
- Mute
- Subscribe to RSS Feed
- Permalink
- Report Inappropriate Content
May be this:
- Mark as New
- Bookmark
- Subscribe
- Mute
- Subscribe to RSS Feed
- Permalink
- Report Inappropriate Content
Thanks sunny.
This is the exact answer which i needed
- Mark as New
- Bookmark
- Subscribe
- Mute
- Subscribe to RSS Feed
- Permalink
- Report Inappropriate Content
Awesome 
I am glad we found the answer you were looking for.
Best,
Sunny
- Mark as New
- Bookmark
- Subscribe
- Mute
- Subscribe to RSS Feed
- Permalink
- Report Inappropriate Content
Hi Sunny,
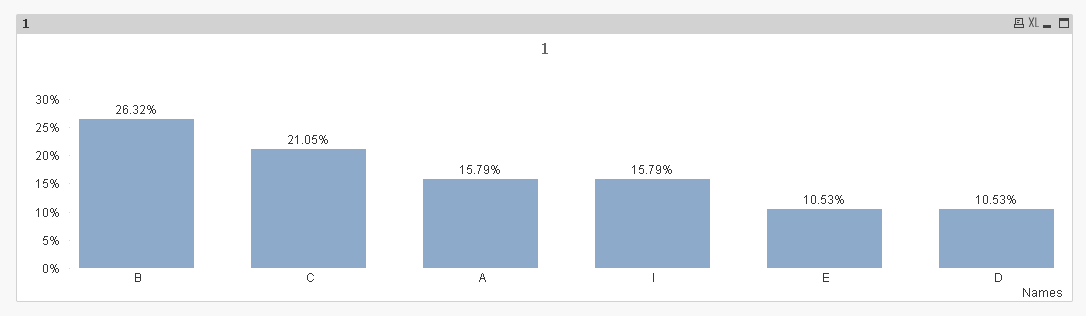
I found an error in your attached file i.e if i select any value it showing 100% instead of original value.
for example if i click A it showing 100% instead of 15.79%.
Can you please rectify it and send me new file
Thanks in advance,
Regards,
Chinnu.
- Mark as New
- Bookmark
- Subscribe
- Mute
- Subscribe to RSS Feed
- Permalink
- Report Inappropriate Content
Try this expression:
=If(Count(values) > 0,
Count({<Names = {"=Only({<Names = >}Aggr(NODISTINCT Rank(Count({<Names = >} values), 0, 1), Names)) < 6"}>} values)/
Count(TOTAL{<Names = {"=Only({<Names = >}Aggr(NODISTINCT Rank(Count({<Names = >} values), 0, 1), Names)) < 6"}>} values))
- Mark as New
- Bookmark
- Subscribe
- Mute
- Subscribe to RSS Feed
- Permalink
- Report Inappropriate Content
Thanks a lot sunny now its perfect
- Mark as New
- Bookmark
- Subscribe
- Mute
- Subscribe to RSS Feed
- Permalink
- Report Inappropriate Content
Hi sunny,
I am still not able to resolve my issue so i am attaching again my sample data can u please help me
based on the number of incidents the graph should show the top 10 ISSUES(dimension).
The graph should reflect past 12 months data. and past 3 months data in same bar chart.. side by side
And All the data points must be equal to 100% which u have already given query earlier
For example: if the reporting month i october2015, the data should reflect from november2014-october2015.
and the past 3 months data should reflect from august 2015 to October 2015.
Thanks in Advance.
Regards,
Chinnu.
- Mark as New
- Bookmark
- Subscribe
- Mute
- Subscribe to RSS Feed
- Permalink
- Report Inappropriate Content
Hi sunny Can you please suggest any solution for my issue...
- « Previous Replies
-
- 1
- 2
- Next Replies »