Unlock a world of possibilities! Login now and discover the exclusive benefits awaiting you.
- Qlik Community
- :
- All Forums
- :
- QlikView App Dev
- :
- Quartile Logic!!
- Subscribe to RSS Feed
- Mark Topic as New
- Mark Topic as Read
- Float this Topic for Current User
- Bookmark
- Subscribe
- Mute
- Printer Friendly Page
- Mark as New
- Bookmark
- Subscribe
- Mute
- Subscribe to RSS Feed
- Permalink
- Report Inappropriate Content
Quartile Logic!!
Hi All,
Can anyone please share the quartile logic in qlikview.
Load * INLINE [
Sales,Year
500, 2013
10,2014
300,2015
400, 2013
1000,2014
30000,2015
50, 2013
1050,2014
700,2015 ];
Total rows=8
quartile is fetching the particular Sales row value when sorted in ascending order.
25th Quartile=8*0.25=2nd value i.e 2nd row sales value in ascending order.
Output Sales(25th Q)=50
Output Sales(50th Q)=8*0.5=4th value=400
Output Sales(75th Q)=8*0.75=6th value=700
I tried using fractile function but put is not as expected.
can anyone provide the logic. Please note fieldvalue works only on load order. i want sales to be sorted in ascending order first, any function or logic will be a great help!!!
thanks
- Mark as New
- Bookmark
- Subscribe
- Mute
- Subscribe to RSS Feed
- Permalink
- Report Inappropriate Content
The total number of rows that you have is 9 ... not 8. So maybe you get things to add up if you revise accordingly.

- Mark as New
- Bookmark
- Subscribe
- Mute
- Subscribe to RSS Feed
- Permalink
- Report Inappropriate Content
petter thanks for replying. 8 was by mistake. consider 8 rows and share the logic accordingly for implementing quartile as explained above.
- Mark as New
- Bookmark
- Subscribe
- Mute
- Subscribe to RSS Feed
- Permalink
- Report Inappropriate Content
I simply calculated it directly in the GUI with the help of an InputBox with different expressions. This could of course be done both in the load script but also in a particular chart. The expressions will be the same.
- Mark as New
- Bookmark
- Subscribe
- Mute
- Subscribe to RSS Feed
- Permalink
- Report Inappropriate Content
If you are happy with the answer - please close the thread by marking it as answered ... 
- Mark as New
- Bookmark
- Subscribe
- Mute
- Subscribe to RSS Feed
- Permalink
- Report Inappropriate Content
hi Petter,
I think i have already shared the output. the desired output should be as before.
fractile function does not returns the expected result.
moreover, i want a bar chart in which i want quartile values relative to year like 2012,2013,2014,2015.
for e.g
2015 year- sorted quartile values at 0.25,0.5,0.75,1 and so on for 2013, 2014...
- Mark as New
- Bookmark
- Subscribe
- Mute
- Subscribe to RSS Feed
- Permalink
- Report Inappropriate Content
I can't get the reference data right so have a look at this Excel-file where I calculate Quartiles in different ways. I can't reproduce the numbers you have - this is what I get (included the Excel-file for reference):

So which numbers do you consider right for what you want in QlikView. QlikView Fractile()-function works as the .INC (inclusive) functions in Excel....
- Mark as New
- Bookmark
- Subscribe
- Mute
- Subscribe to RSS Feed
- Permalink
- Report Inappropriate Content
hi Petter,
Load * INLINE [
Sales,Year_Test
500, 2013
10,2014
300,2015
400, 2013
1000,2014
30000,2015
50, 2013
1050,2014
700,2015
1500, 2013
15465,2014
6700,2015
50545, 2013
105,2014
70,2015
883,2015
];
Sorry for late replying. Consider the above data set and i want the output in qlikview 3 values at 25 quartile, 50 quartile and 75th quartile which are the corresponding 4th, 8th and 12th row values after sorting . I want it to be dynamic. I have great thousands rows of data year wise. Means if i select year 2013 then it shows corresponding 25%,50% and 75% quartile values in year 2013. For Full data set, i am sharing the expected output, But needs it to be dynamic on selection as well.
Total rows in Sales- 16
16*0.25=4th row value of sales after sorted ascending=105
16*0.50=8th row value after sorted ascending=700
16*0.75=12th row value after sorted ascending= 1500
Expected Output: Quartiles in table box/straight table
Year Sales
2014 105
2015 700
2013 1500
Please remember that it has to be dynamic as well on selection.
Suppose if year 2015 is selected then the output should be 2nd !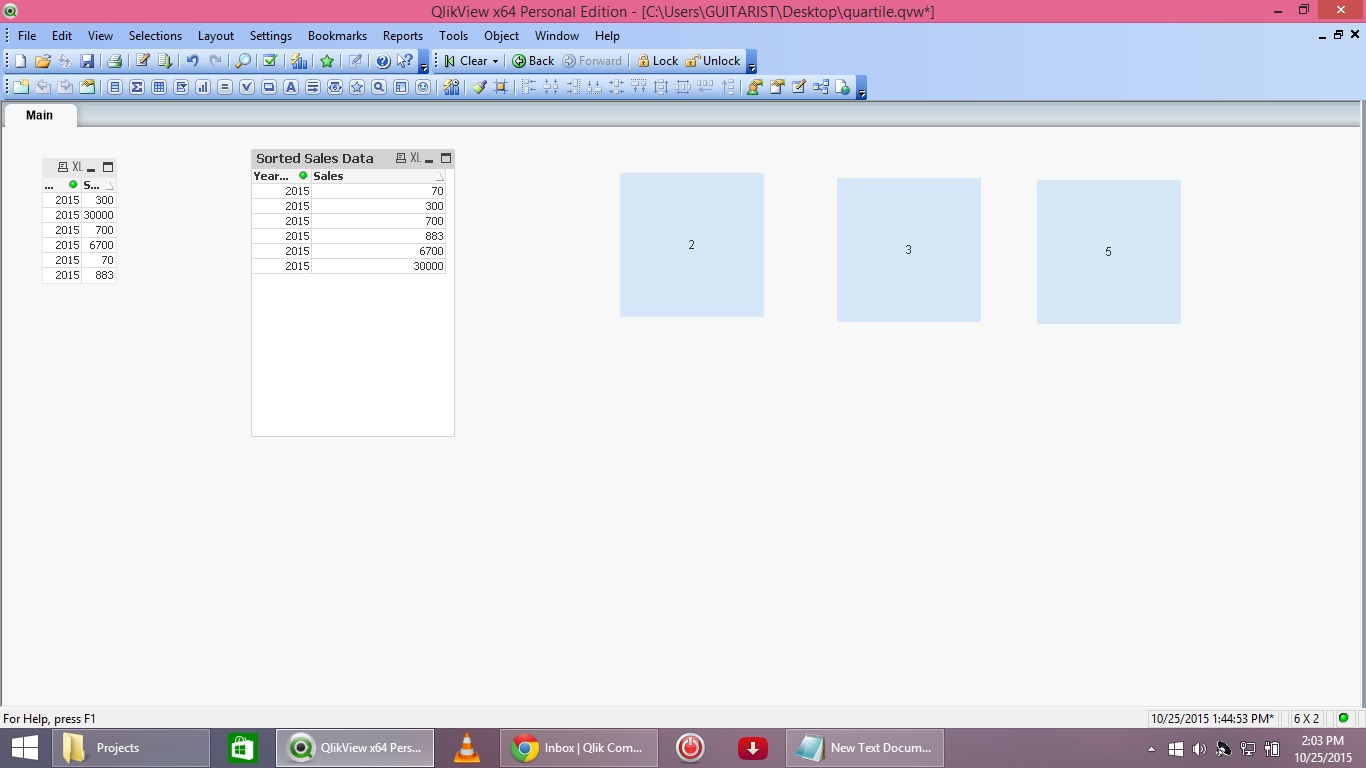 , 3rd and 5th values of year 2015 data set. like:
Year Sales
2015 300
2015 700
2015 6700
Please help any way you can!!!!! thanks
- Mark as New
- Bookmark
- Subscribe
- Mute
- Subscribe to RSS Feed
- Permalink
- Report Inappropriate Content
There are different methods of calculating quartiles. Just look at Wikipedia about quartiles and it will explain the differences quite clearly. The differences are very clear with small data sets - so what you prescribe as the correct on you tiny data set is correct in one method and different in other methods. The important thing is that the differences disappear when a certain amount of numbers is used.
Using the Fractile() function in QlikView is quite easy - just remember that the results you get are based on a particular method and comparing it with another tools function and the results might give different answers - and especially when you have few numbers to calculate over.