Unlock a world of possibilities! Login now and discover the exclusive benefits awaiting you.
Announcements
Live today at 11 AM ET. Get your questions about Qlik Connect answered, or just listen in.
SIGN UP NOW
- Qlik Community
- :
- Forums
- :
- Analytics
- :
- New to Qlik Analytics
- :
- Average per product compared to total avarege
Options
- Subscribe to RSS Feed
- Mark Topic as New
- Mark Topic as Read
- Float this Topic for Current User
- Bookmark
- Subscribe
- Mute
- Printer Friendly Page
Turn on suggestions
Auto-suggest helps you quickly narrow down your search results by suggesting possible matches as you type.
Showing results for
Not applicable
2015-11-17
09:15 AM
- Mark as New
- Bookmark
- Subscribe
- Mute
- Subscribe to RSS Feed
- Permalink
- Report Inappropriate Content
Average per product compared to total avarege
I have a set of data like this (in orange)

The average per product is in blue and know I like to calculate the 'average per product' devided by the 'total avere' and put the numbers (those in green) in a bar chart.
Example Product A:
The average is 3.5 ((5+2) / 2 ) and compared to the total average i get 92 % (3.5 / 3.8 * 100)
Example Product C:
The average is 5 ((6+4) / 2 ) and compared to the total average i get 132 % (5 / 3.8 * 100)
How do I do that?
469 Views
1 Solution
Accepted Solutions
MVP
2015-11-17
09:28 AM
- Mark as New
- Bookmark
- Subscribe
- Mute
- Subscribe to RSS Feed
- Permalink
- Report Inappropriate Content
381 Views
2 Replies
MVP
2015-11-17
09:28 AM
- Mark as New
- Bookmark
- Subscribe
- Mute
- Subscribe to RSS Feed
- Permalink
- Report Inappropriate Content
This?
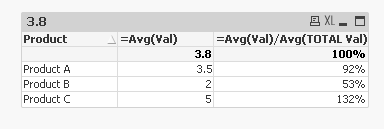
Expression 1: =Avg(Val)
Expression 2: =Avg(Val)/Avg(TOTAL Val)
382 Views
Not applicable
2015-11-18
03:22 AM
Author
- Mark as New
- Bookmark
- Subscribe
- Mute
- Subscribe to RSS Feed
- Permalink
- Report Inappropriate Content
Thanks - I wasn't aware of the 'Total function':
=Avg(Val)/Avg(TOTAL Val)
381 Views
Community Browser