Unlock a world of possibilities! Login now and discover the exclusive benefits awaiting you.
- Qlik Community
- :
- Forums
- :
- Analytics
- :
- App Development
- :
- customer sales report
- Subscribe to RSS Feed
- Mark Topic as New
- Mark Topic as Read
- Float this Topic for Current User
- Bookmark
- Subscribe
- Mute
- Printer Friendly Page
- Mark as New
- Bookmark
- Subscribe
- Mute
- Subscribe to RSS Feed
- Permalink
- Report Inappropriate Content
customer sales report
Hi everybody,
I making a sales report,
How can I show the customers that stooped buying and also showing customers that there sales started slowing down?
- Mark as New
- Bookmark
- Subscribe
- Mute
- Subscribe to RSS Feed
- Permalink
- Report Inappropriate Content
Hi Jhonatan,
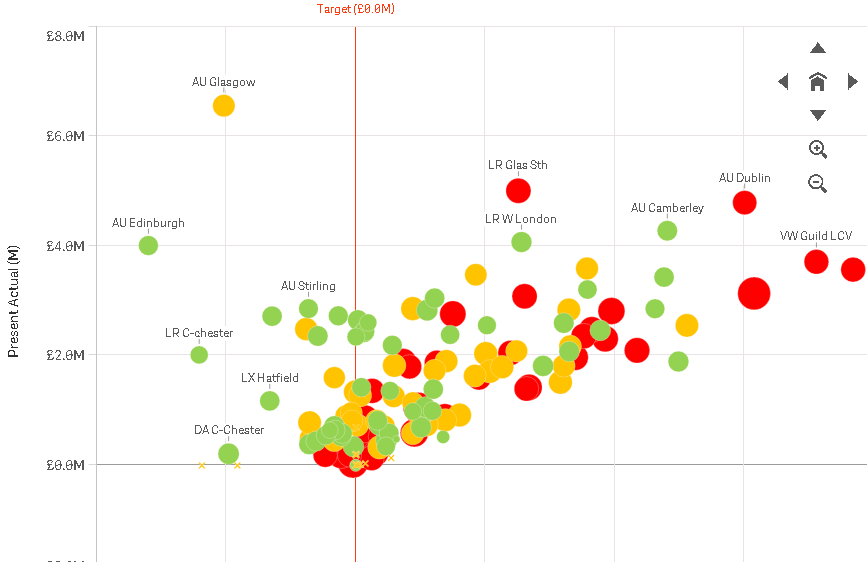
Make use of a scatter plot, so that it takes 3 measures
measure 1 being the sales/customer
Measure 2 and 3 being the time since the last purchase. This will give you the size and you can color code the bubbles with an expression.
Its going to look some thing Like this:
Thanks and Regards,
Sangram Reddy.
- Mark as New
- Bookmark
- Subscribe
- Mute
- Subscribe to RSS Feed
- Permalink
- Report Inappropriate Content
thank you Sangram Reddy ,
but i need to somehow show it on a pivot table....
still need help...
- Mark as New
- Bookmark
- Subscribe
- Mute
- Subscribe to RSS Feed
- Permalink
- Report Inappropriate Content
Hi Jhonatan,
You can show it in a very intuitive way using a pivot table as well.
Try creating some thing like this.
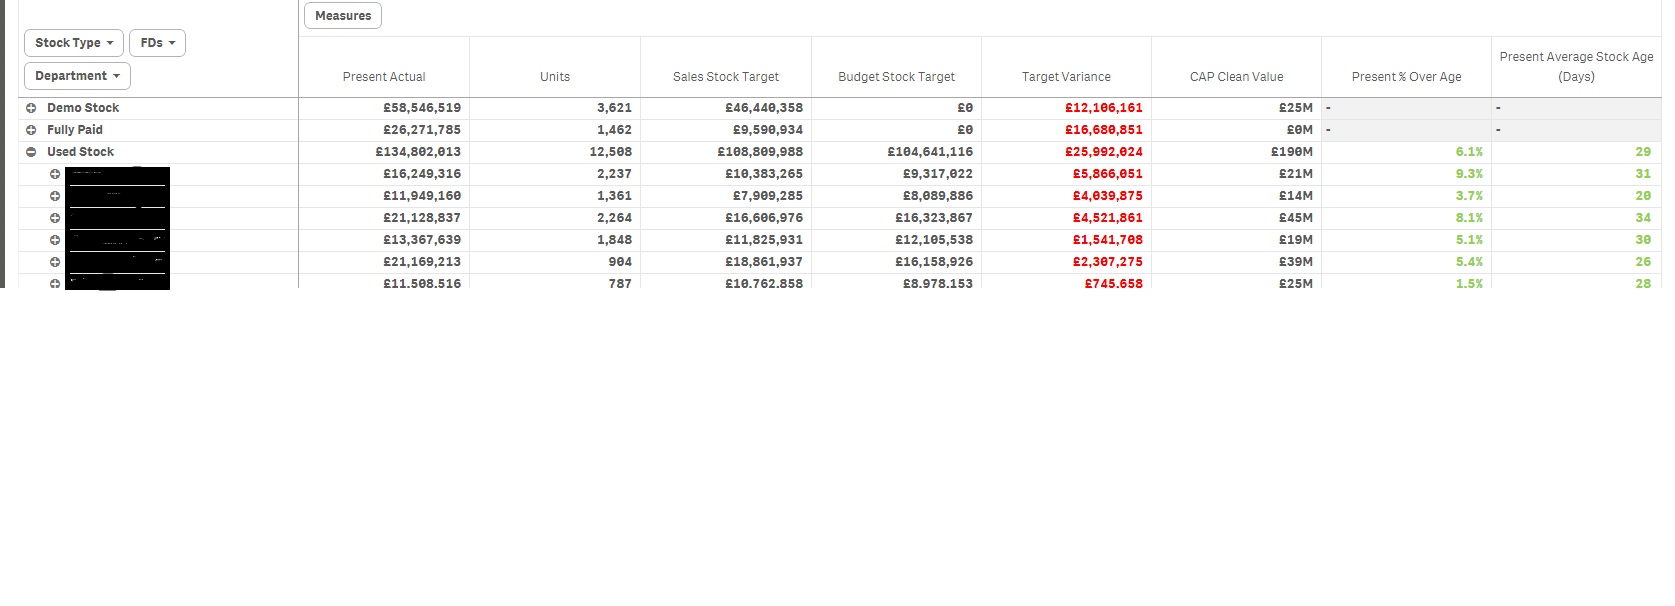
Let me know if you need help with this.
- Sangram
- Mark as New
- Bookmark
- Subscribe
- Mute
- Subscribe to RSS Feed
- Permalink
- Report Inappropriate Content
Hey Sangram i need some help,
Again as I originally posted I need to show the customers that recently have stopped buying on a pivot table…
- Mark as New
- Bookmark
- Subscribe
- Mute
- Subscribe to RSS Feed
- Permalink
- Report Inappropriate Content
Hi Jhonatan,
What you are referring here is Customer Churn. So it would be helpfull to find out the number of days it has been since their last purchase.
Ex: If a customer made a purchase on 1st of August and no purchase there after, then no of days since the customer has bought something would be today() - 1st of August = x no of days. You can use this in your pivot table as a measure.(Order this measure , so it would give you the list of customers who have no bought any thing from a long time)
If you are looking at a higher level like the departments or Franchises, looking at the trend of Customer churn will also be very useful.