Unlock a world of possibilities! Login now and discover the exclusive benefits awaiting you.
- Qlik Community
- :
- Forums
- :
- Analytics
- :
- New to Qlik Analytics
- :
- Count depending on ...
- Subscribe to RSS Feed
- Mark Topic as New
- Mark Topic as Read
- Float this Topic for Current User
- Bookmark
- Subscribe
- Mute
- Printer Friendly Page
- Mark as New
- Bookmark
- Subscribe
- Mute
- Subscribe to RSS Feed
- Permalink
- Report Inappropriate Content
Count depending on ...
This is a snip of my data file
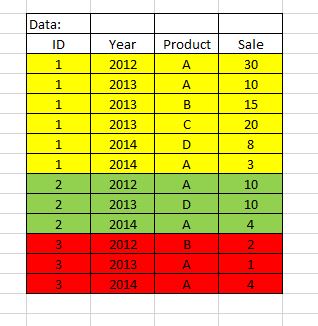
How do I count how many ID has sold product A in all three years (2012, 2013 and 2014). As you can see it's only ID 1.
Accepted Solutions
- Mark as New
- Bookmark
- Subscribe
- Mute
- Subscribe to RSS Feed
- Permalink
- Report Inappropriate Content
Maybe something like this (e.g used in a straight table chart with dimension Product):
=Sum( Aggr( If( Count(Distinct Year) =3,1,0), ID, Product))
Or do you want to only count IDs where every Product showed up in all years?
- Mark as New
- Bookmark
- Subscribe
- Mute
- Subscribe to RSS Feed
- Permalink
- Report Inappropriate Content
Try
=COUNT({<ID = {"=Count( {<Product = {'A'}>} DISTINCT Year)=3"} >} DISTINCT ID)
- Mark as New
- Bookmark
- Subscribe
- Mute
- Subscribe to RSS Feed
- Permalink
- Report Inappropriate Content
Try what swuhl suggested, also if you are having more Years and if you want to have for 2012-2014 then edit it:
like: =COUNT({<Product = {'A'}, Year={'2012','2013','2014'}>} DISTINCT ID)
Hope this will help!!
- Mark as New
- Bookmark
- Subscribe
- Mute
- Subscribe to RSS Feed
- Permalink
- Report Inappropriate Content
Thanks - it works with Product A.
How do I modify the expression to cover all the products (and not only Product A).
- Mark as New
- Bookmark
- Subscribe
- Mute
- Subscribe to RSS Feed
- Permalink
- Report Inappropriate Content
for all product, simply just write:
=count(distinct ID) as expression
- Mark as New
- Bookmark
- Subscribe
- Mute
- Subscribe to RSS Feed
- Permalink
- Report Inappropriate Content
I guess not.
I still need check whether the product has been sold in all three years.
- Mark as New
- Bookmark
- Subscribe
- Mute
- Subscribe to RSS Feed
- Permalink
- Report Inappropriate Content
Maybe something like this (e.g used in a straight table chart with dimension Product):
=Sum( Aggr( If( Count(Distinct Year) =3,1,0), ID, Product))
Or do you want to only count IDs where every Product showed up in all years?
- Mark as New
- Bookmark
- Subscribe
- Mute
- Subscribe to RSS Feed
- Permalink
- Report Inappropriate Content
Thanks - this was exactly what I was looking for.
Maybe you could explain the expression? Especially the
= 3,1,0 part
Sum( Aggr( If( Count(Distinct Year) =3,1,0), ID, Product))
- Mark as New
- Bookmark
- Subscribe
- Mute
- Subscribe to RSS Feed
- Permalink
- Report Inappropriate Content
The advanced aggregation aggr() creates a temporary internal table, like a straight table with two dimensions,
ID and Product.
The expression in this internal table is
=If( Count(Distinct Year)=3 ,1,0)
Hence, for each combination of Product and ID, QV will calculate the distinct count of years. If it equals 3, this means for your sample data, that all three years 2013, 2014, 2015 must have a relation to that combination of Product and ID.
The If() statement will return 1 in this case and if there are less then three years counted, zero.
So if you use this advanced aggregation expression in a chart with dimension Product, it will return the sum of all internal table lines where the internal and external Product dimension values match, i.e. the number / count of IDs that fulfill the requirement.
Might sound a bit complicated, I suggest that you create a straight table with dimensions and expression as indicated above. This should clarify all issues.