Unlock a world of possibilities! Login now and discover the exclusive benefits awaiting you.
- Qlik Community
- :
- All Forums
- :
- QlikView App Dev
- :
- How change a color in a dynamic expression
- Subscribe to RSS Feed
- Mark Topic as New
- Mark Topic as Read
- Float this Topic for Current User
- Bookmark
- Subscribe
- Mute
- Printer Friendly Page
- Mark as New
- Bookmark
- Subscribe
- Mute
- Subscribe to RSS Feed
- Permalink
- Report Inappropriate Content
How change a color in a dynamic expression
I need to change color in a bar chart that have this expression.
=(if(vView='MWh' and vTime='Month', Only (MonthProd), if(vView='MWh' and vTime='Year',Only(YearProd),
if(vView='Revenue' and vTime='Month', Only (MonthRevenue), if(vView='Revenue' and vTime='Year',Only(YearRevenue),
if(vView='Opex' and vTime='Month', Only (MonthOpex), if(vView='Opex' and vTime='Year',Only(YearOpex))))))))
vView and vTime are variables.
where MonthProd, YearProd.. etc are all different expression.
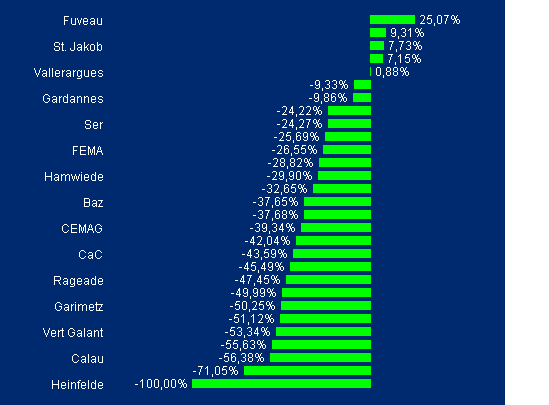
this is my chart and I want that the bar chart change color(Red) when the value is < 0 for example.
thanks
Pasquale
- Tags:
- new_to_qlikview
- Mark as New
- Bookmark
- Subscribe
- Mute
- Subscribe to RSS Feed
- Permalink
- Report Inappropriate Content
try with ur expression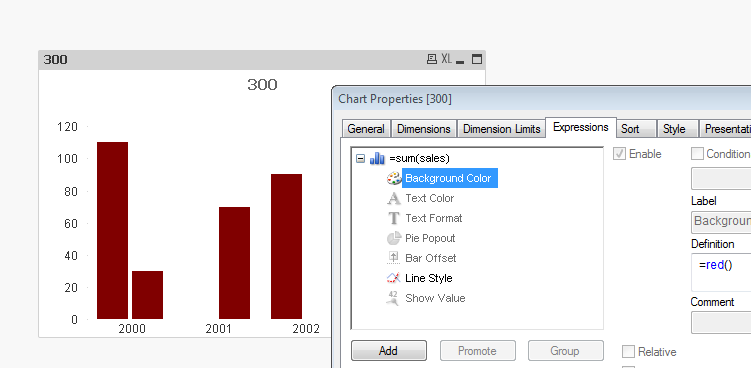 like below.
- Mark as New
- Bookmark
- Subscribe
- Mute
- Subscribe to RSS Feed
- Permalink
- Report Inappropriate Content
Hello,
in your chart, go to colors tab, select the first colour of the list and change the base color by a calculated one:
if(sum(sales) >0, green(), red())
- Mark as New
- Bookmark
- Subscribe
- Mute
- Subscribe to RSS Feed
- Permalink
- Report Inappropriate Content
If this is all one expression, you should be able to reference the expressions name in the background color attribute - so If([Your Expression Name] < 0, Red(),) for example.
- Mark as New
- Bookmark
- Subscribe
- Mute
- Subscribe to RSS Feed
- Permalink
- Report Inappropriate Content
Hi PasCos88
First give a label name to your Expression like
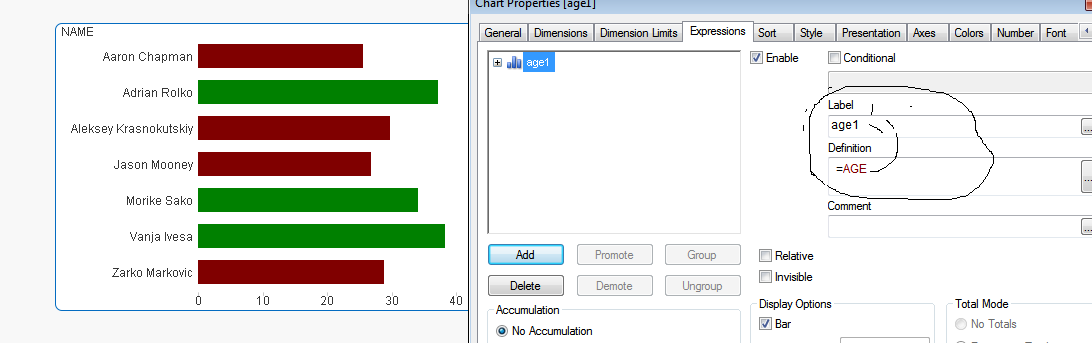
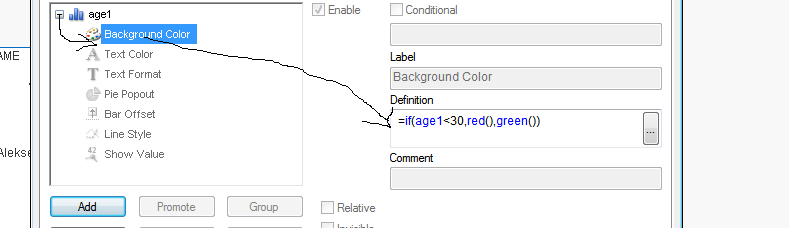
Next write the following condition based on the above label name
- Mark as New
- Bookmark
- Subscribe
- Mute
- Subscribe to RSS Feed
- Permalink
- Report Inappropriate Content
Thanks all for the quick reply.
It is work well really thanks.
If some one can help me again, I have another problem. 
I need to return 2 expression in one if condition.
i.e
if(vVariable = 'Yes', Only(A) and Only(B), if(vVariable='No', Only(C) and Only(D)))
A and B or C and D will be show like a bar in the same chart.
Thanks for replay
Pasquale
- Mark as New
- Bookmark
- Subscribe
- Mute
- Subscribe to RSS Feed
- Permalink
- Report Inappropriate Content
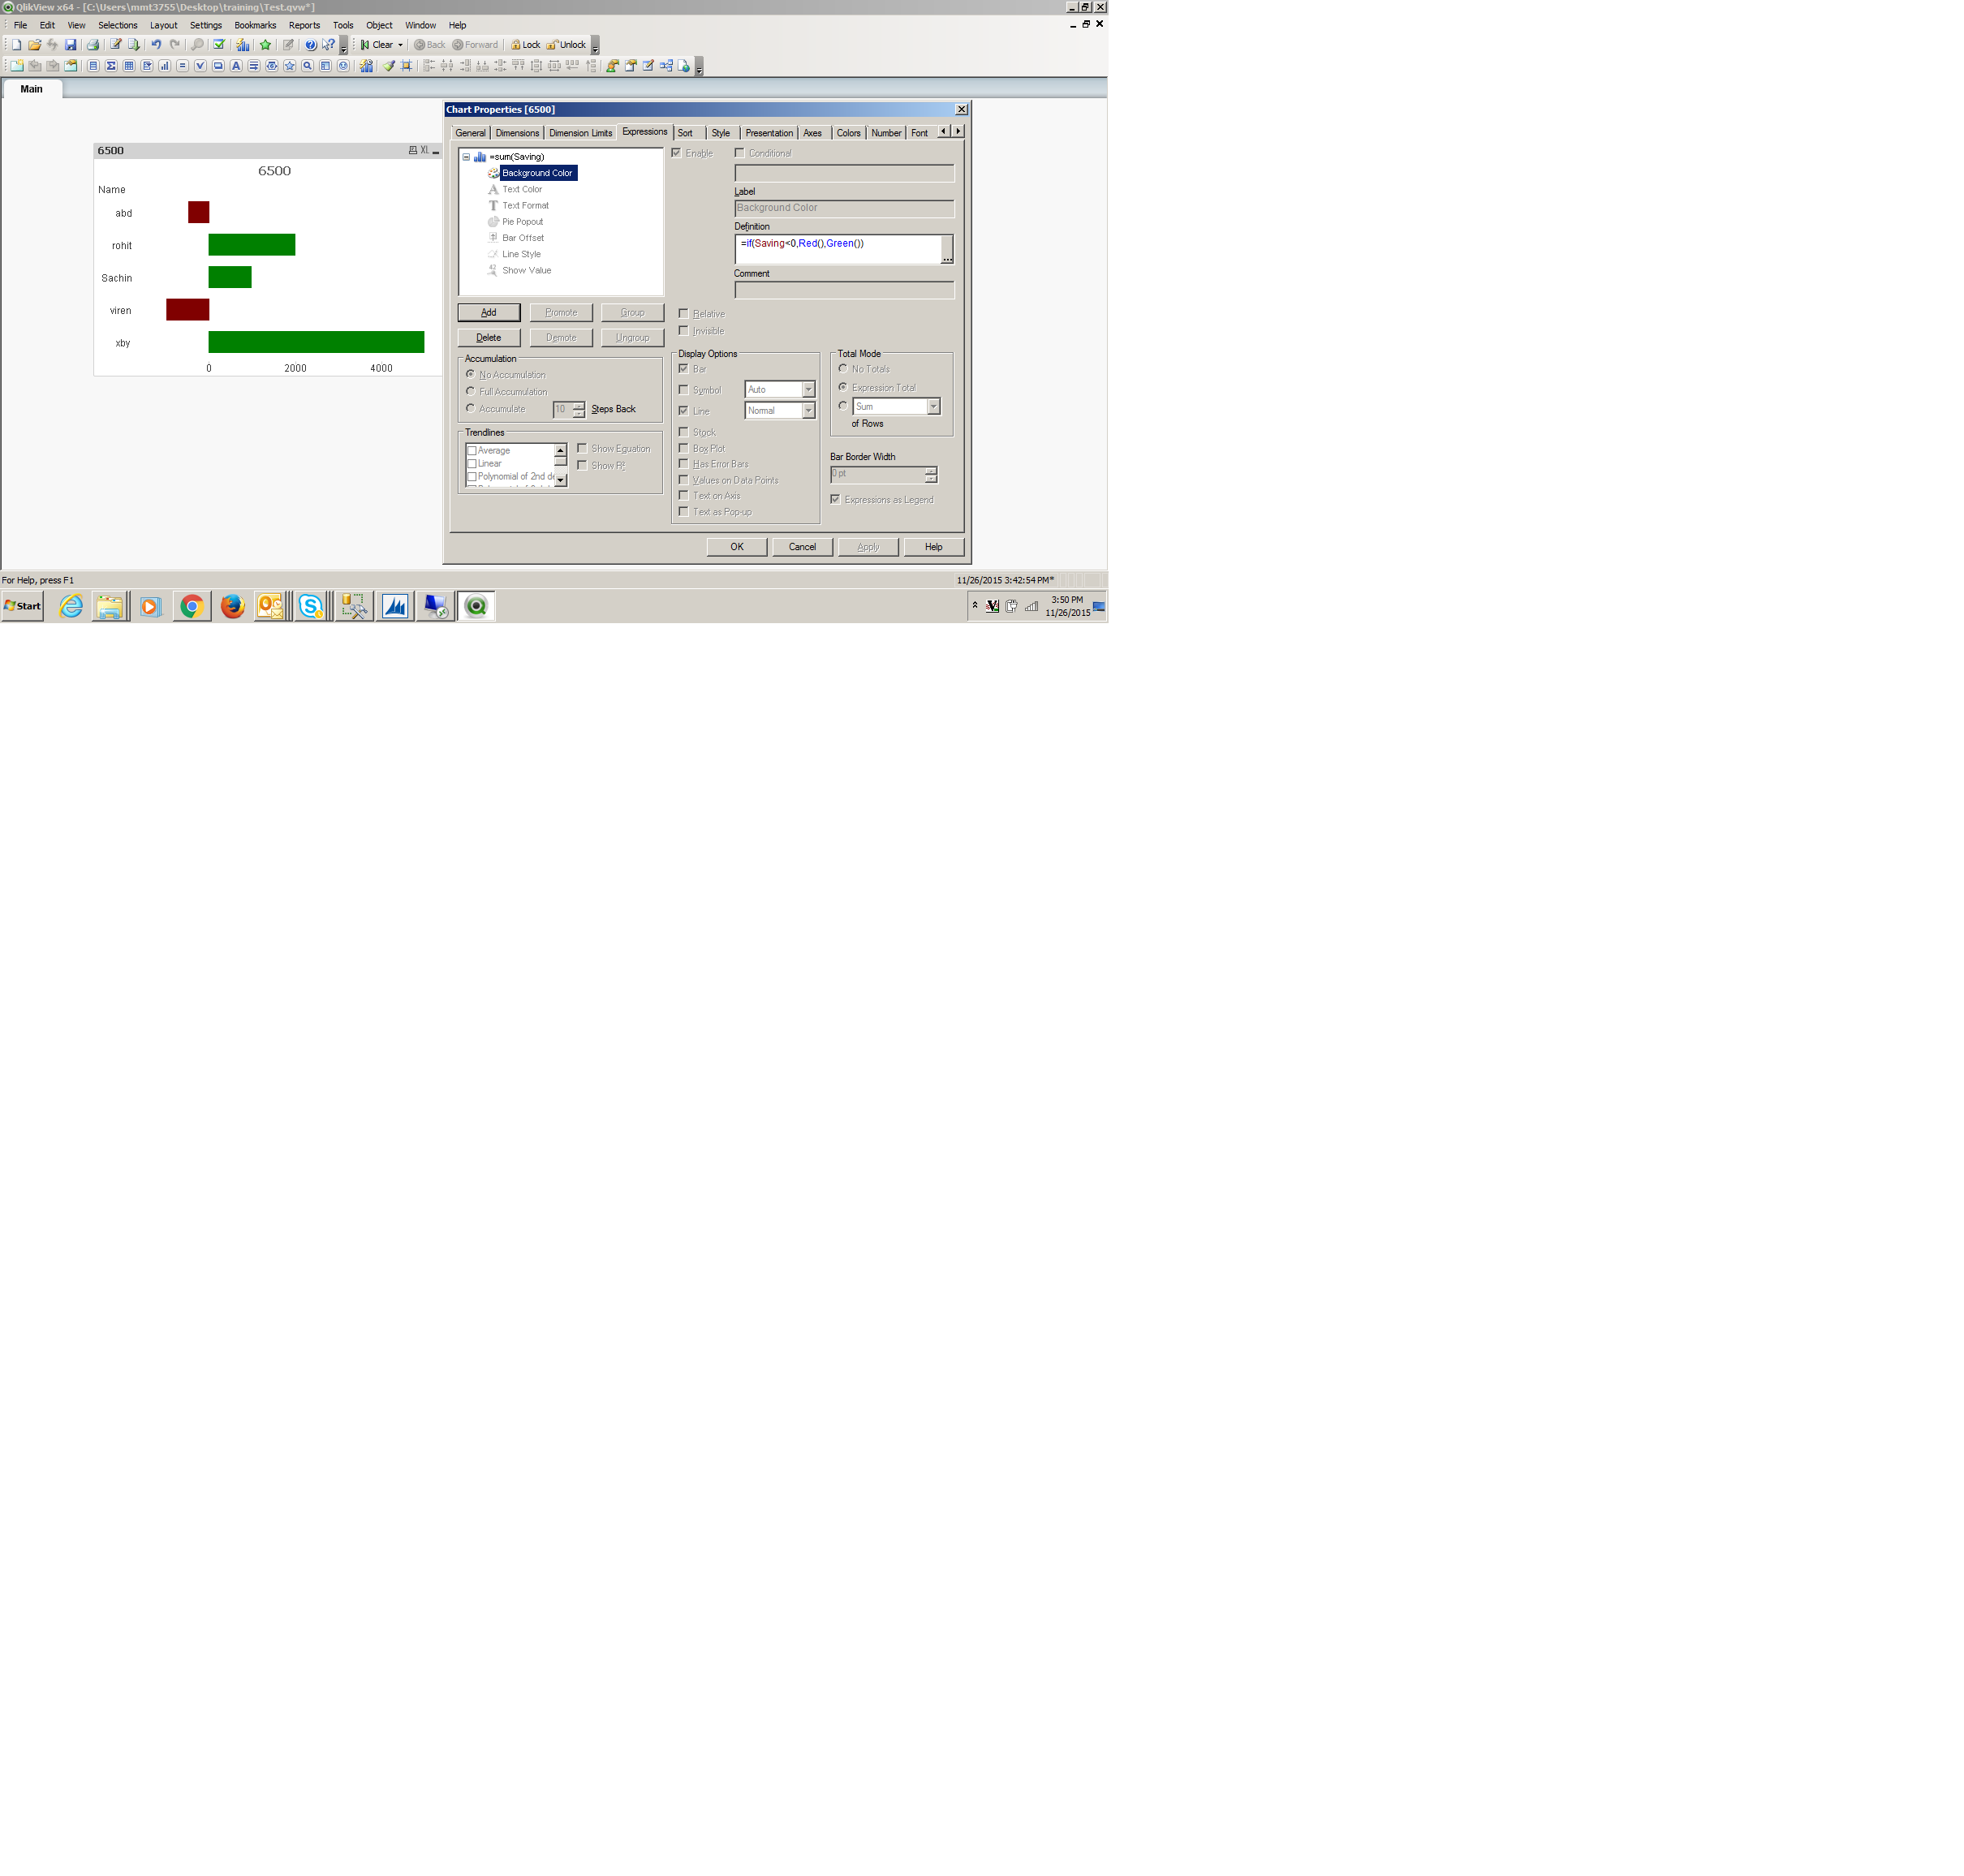
Hi pasquale,
Refer Schreen shot to get the colring for your expression
- Mark as New
- Bookmark
- Subscribe
- Mute
- Subscribe to RSS Feed
- Permalink
- Report Inappropriate Content
If you have to colour code based on other measures which are not being used in a visualization, you can make use of the colour mix wizad from the expression editor screen as well. This will help you build complex colours expressions with ease.
Check this out : Qlikview ColorMix Wizard
- Mark as New
- Bookmark
- Subscribe
- Mute
- Subscribe to RSS Feed
- Permalink
- Report Inappropriate Content
Hi Pasquale,
I am assuming that this is a measure. If so, it would be easy if you use set analysis
For example: if(vVariable = 'Yes',sum({$< company = {'A','B'}>}sales), if(vVariable='No', sum({$< company = {'C','D'}>}sales)
- Mark as New
- Bookmark
- Subscribe
- Mute
- Subscribe to RSS Feed
- Permalink
- Report Inappropriate Content
is possible return 2 expression in one if condition?
thanks Sangram with your replay.
Maybe here you can better understand what I looking for.
A B C D are the expression that I want show in a chart if I have a particolar condition 