Unlock a world of possibilities! Login now and discover the exclusive benefits awaiting you.
- Qlik Community
- :
- Forums
- :
- Analytics
- :
- New to Qlik Analytics
- :
- I have sample files like below. How to make plot w...
- Subscribe to RSS Feed
- Mark Topic as New
- Mark Topic as Read
- Float this Topic for Current User
- Bookmark
- Subscribe
- Mute
- Printer Friendly Page
- Mark as New
- Bookmark
- Subscribe
- Mute
- Subscribe to RSS Feed
- Permalink
- Report Inappropriate Content
I have sample files like below. How to make plot with Date.Time with Channel & Agent.Name
| Date.Time | Channel | Agent.Name |
| 7/1/2014 0:00 | Zap/1 | Vikas |
| 7/1/2014 0:00 | Zap/4 | Vikas |
| 7/1/2014 0:00 | Zap/2 | Vikas |
| 7/1/2014 0:00 | Zap/6 | Vikas |
| 7/1/2014 1:00 | Zap/13 | Vikas |
| 7/1/2014 3:00 | Zap/13 | Vikas |
| 7/1/2014 6:00 | Zap/7 | Vikas |
| 7/1/2014 7:00 | Zap/11 | Vikas |
| 7/1/2014 7:00 | Zap/12 | Vikas |
| 7/1/2014 7:00 | Zap/12 | Vikas |
| 7/1/2014 7:00 | Zap/13 | Vikas |
| 7/1/2014 8:00 | Zap/4 | Lalit |
| 7/1/2014 8:00 | Zap/13 | Lalit |
| 7/1/2014 8:00 | Zap/15 | Vikas |
| 7/1/2014 8:00 | Zap/3 | Lalit |
| 7/1/2014 8:00 | Zap/2 | Lalit |
| 7/1/2014 8:00 | Zap/5 | Vineet |
Hi All.
I have sample files like below. How to make plot with Date.Time VS Channel & Agent.Name
Thanks & Regards,
Bibhuti
- Mark as New
- Bookmark
- Subscribe
- Mute
- Subscribe to RSS Feed
- Permalink
- Report Inappropriate Content
what would be your measure?
is it sum(Hours)?
I wud say, create a Drill group like & use Block/Mekko chart:
AgentNAme - > Channel -> Date.Time as Dimension
Measure sth like: sum(HOURS)
- Mark as New
- Bookmark
- Subscribe
- Mute
- Subscribe to RSS Feed
- Permalink
- Report Inappropriate Content
Hi,
You can create Straight table also like
LOAD Timestamp(Timestamp#(Date.Time,'DD/MM/YYYY h:ss'),'DD/MM/YYYY h:ss') as Date.Time,Channel,Agent.Name;
LOAD * Inline
[
Date.Time, Channel, Agent.Name
7/1/2014 0:00, Zap/1, Vikas
7/1/2014 0:00, Zap/4, Vikas
7/1/2014 0:00, Zap/2, Vikas
7/1/2014 0:00, Zap/6, Vikas
7/1/2014 1:00, Zap/13, Vikas
7/1/2014 3:00, Zap/13, Vikas
7/1/2014 6:00, Zap/7, Vikas
7/1/2014 7:00, Zap/11, Vikas
7/1/2014 7:00, Zap/12, Vikas
7/1/2014 7:00, Zap/12, Vikas
7/1/2014 7:00, Zap/13, Vikas
7/1/2014 8:00, Zap/4, Lalit
7/1/2014 8:00, Zap/13, Lalit
7/1/2014 8:00, Zap/15, Vikas
7/1/2014 8:00, Zap/3, Lalit
7/1/2014 8:00, Zap/2, Lalit
7/1/2014 8:00, Zap/5, Vineet
];
Dim1:- Channel
Dim2:- Agent.Name
Expre:- Only(Date.Time)
Regards
Anand
- Mark as New
- Bookmark
- Subscribe
- Mute
- Subscribe to RSS Feed
- Permalink
- Report Inappropriate Content
Hi Bibhuti,
I have made an example for you and this is the best way to visualize your data.
First load your data and transform it the way I did in the qvf attached once done use the TimeLine visual.
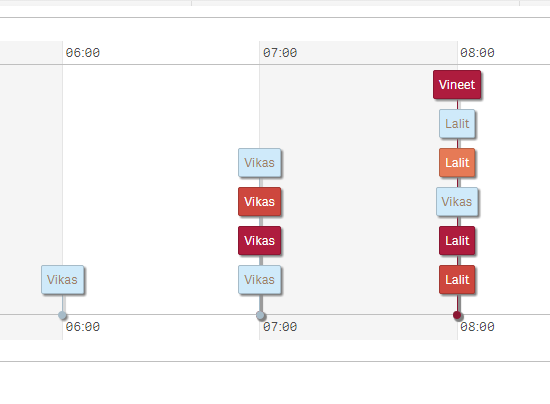
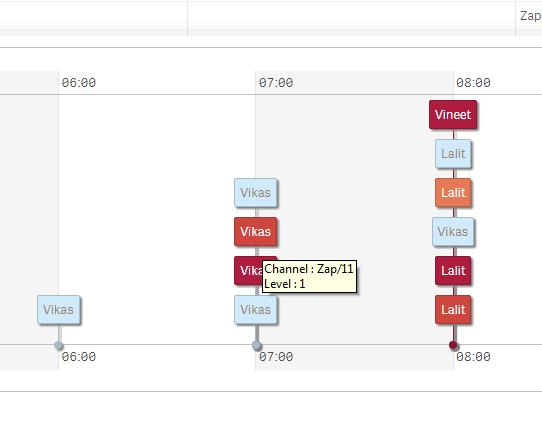
You can Zoom and Pan this visual and works great! You can download it from Qlik Sense interactve Timeline - all thanks to Ralf
You have lot of customizing options available(I used the ones you need for your requirment in the QVF) but if you need more, you can extended this visualization to fit your business requirement.
Please find the QVF attached!
- Sangram