Unlock a world of possibilities! Login now and discover the exclusive benefits awaiting you.
- Qlik Community
- :
- Forums
- :
- Analytics
- :
- New to Qlik Analytics
- :
- Total Number in the Graph and Showing the Data in ...
Options
- Subscribe to RSS Feed
- Mark Topic as New
- Mark Topic as Read
- Float this Topic for Current User
- Bookmark
- Subscribe
- Mute
- Printer Friendly Page
Turn on suggestions
Auto-suggest helps you quickly narrow down your search results by suggesting possible matches as you type.
Showing results for
Not applicable
2015-12-10
10:28 AM
- Mark as New
- Bookmark
- Subscribe
- Mute
- Subscribe to RSS Feed
- Permalink
- Report Inappropriate Content
Total Number in the Graph and Showing the Data in percentages
Hi,
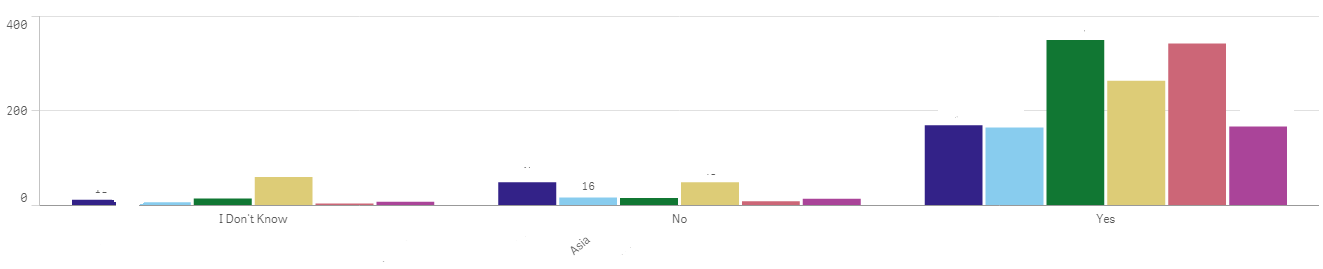
We have two questions for Qlik Sense. We are trying to show data from a survey. The picture below applies to both questions.
1. Is there a way to display the counts for each bar as a percent of the total respondents? For example, what is the percentage of people in Asia responding "No?" Note: We have an expression that takes out people who didn't respond to this question. The percentages should take this into account.
2. In the picture, you can see the totals for each region that responded "Yes," "No," or "I Don't Know." How can we also show a total count of all regions in the same graph?
- Tags:
- qlik sense
169 Views
0 Replies
Community Browser