Unlock a world of possibilities! Login now and discover the exclusive benefits awaiting you.
- Qlik Community
- :
- Forums
- :
- Analytics
- :
- New to Qlik Analytics
- :
- in Qlik Sense how to display a summary number
- Subscribe to RSS Feed
- Mark Topic as New
- Mark Topic as Read
- Float this Topic for Current User
- Bookmark
- Subscribe
- Mute
- Printer Friendly Page
- Mark as New
- Bookmark
- Subscribe
- Mute
- Subscribe to RSS Feed
- Permalink
- Report Inappropriate Content
in Qlik Sense how to display a summary number
On my story I need to display a summary KPI which is a single number that aggregates all the KPIs for the department and gives the general trend for the selected month.
since I know dynamic text is currently not availble I thouhgt about using a table and simply getting rid of the header but this doesn't seem to be possible either. Any idea on how to achieve that goal of just getting a single number without fuss around it?
thanks
Accepted Solutions
- Mark as New
- Bookmark
- Subscribe
- Mute
- Subscribe to RSS Feed
- Permalink
- Report Inappropriate Content
Create a KPI object of your summary and bring it into your story. No need to use a table in this case.
- Mark as New
- Bookmark
- Subscribe
- Mute
- Subscribe to RSS Feed
- Permalink
- Report Inappropriate Content
Hi Oliver,
Firstly create a new measure (expression) which summarizes all the KPIs into one. Create a new sheet and place the KPI on that sheet and Save it.
Go to stories and create a new sheet by selecting the "+" button :
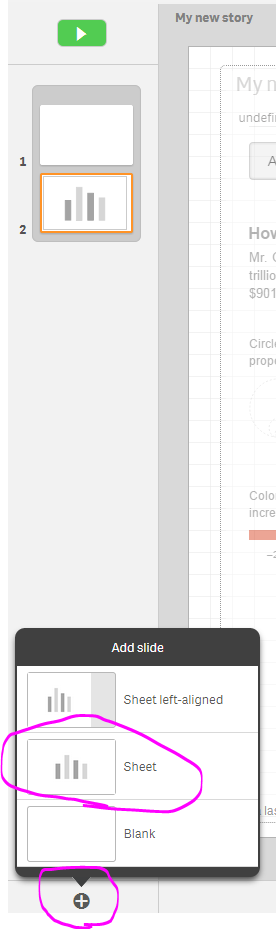
and select embed sheet.
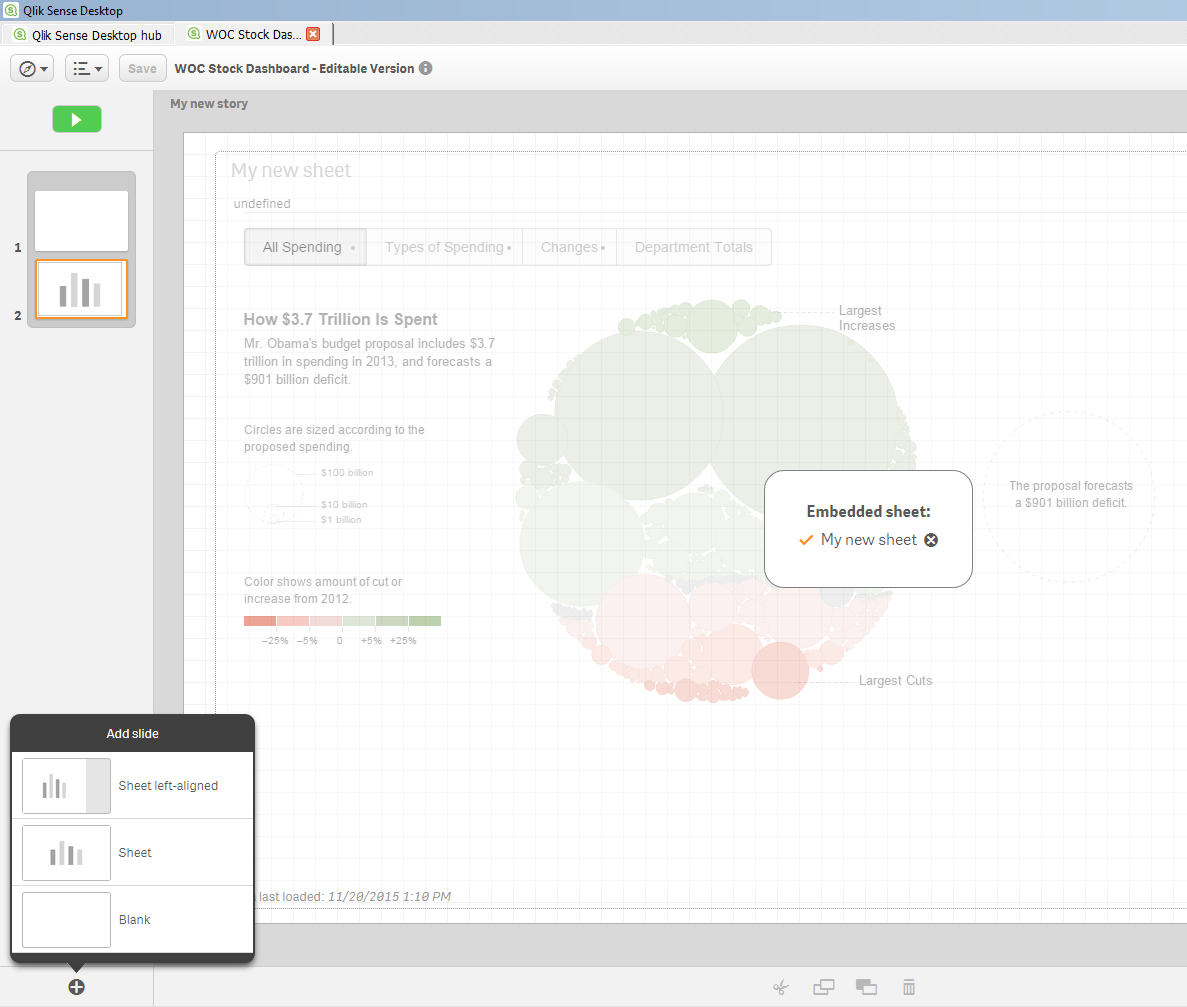
Now select the sheet you want to embed and it will look like this:
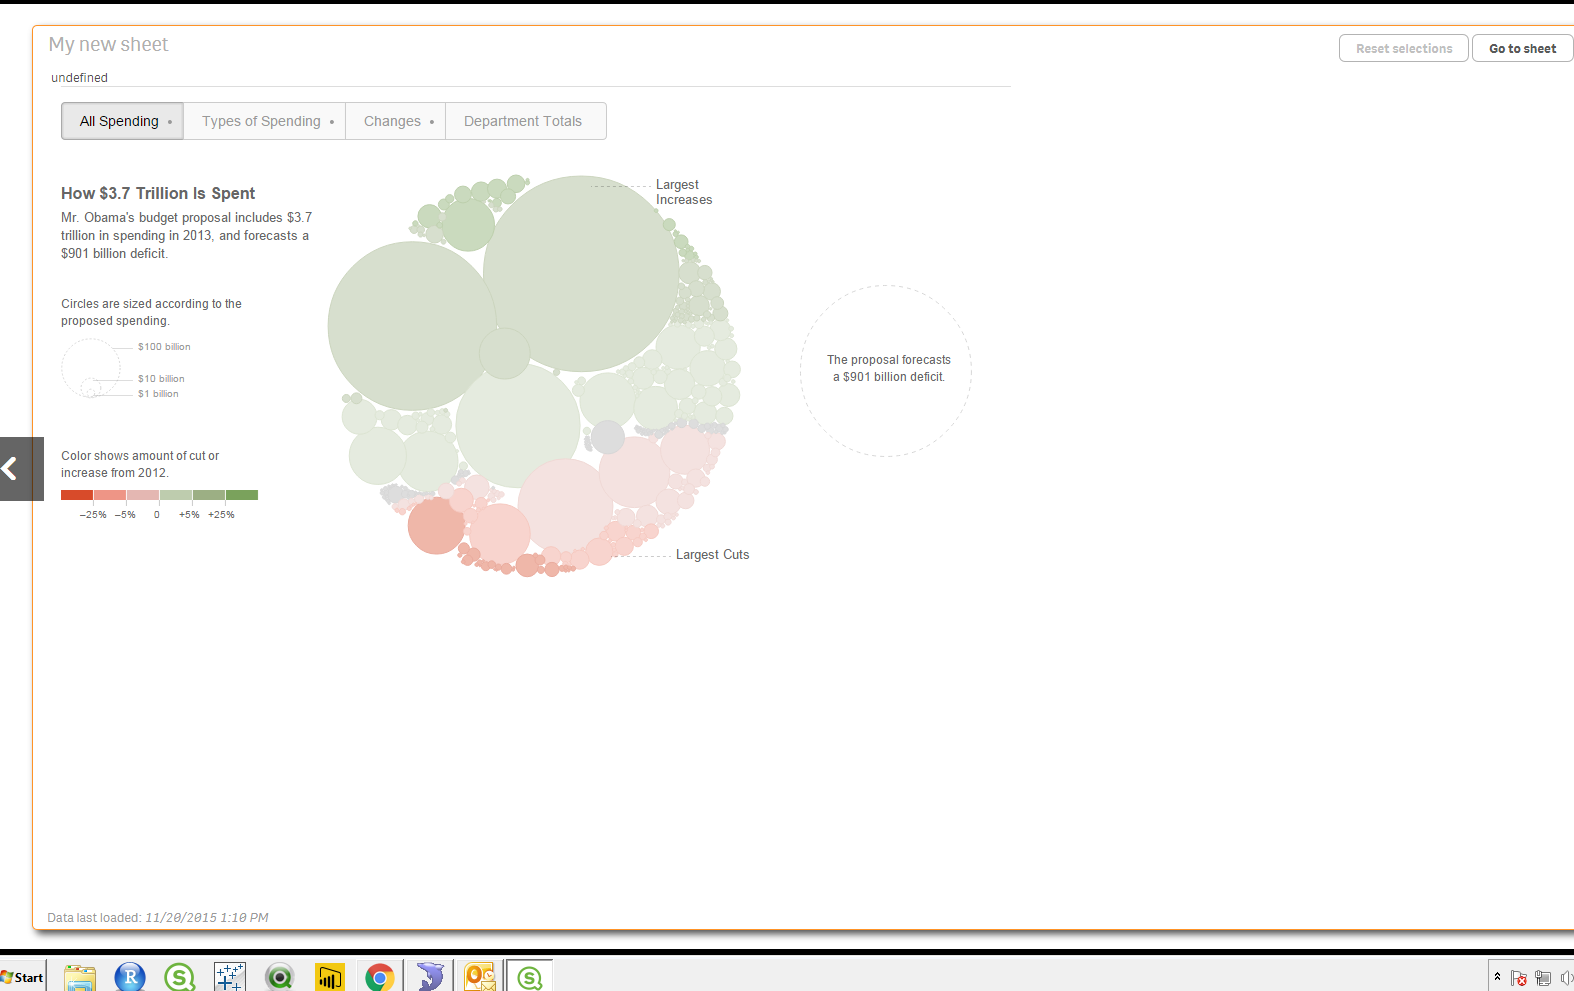
Now the sheet which has been embeded can be viewed using the play button on top:
and this will be refreshed every time the data is reloaded. Where as if you embed a snap shot its a static image which does't get refreshed.
Hope this helps
- Sangram
- Mark as New
- Bookmark
- Subscribe
- Mute
- Subscribe to RSS Feed
- Permalink
- Report Inappropriate Content
Create a KPI object of your summary and bring it into your story. No need to use a table in this case.
- Mark as New
- Bookmark
- Subscribe
- Mute
- Subscribe to RSS Feed
- Permalink
- Report Inappropriate Content
I don`t get it 😞
In the story editor I don't have access to the measures and in the sheet editor I do have access to my summart KPI object but when I drag it onnto the the sheet a bar chart get created.
I originally thought about putting it in a text visualization but I read that dynamic text is not currently supported (expressions seem to only be supported in titles)
- Mark as New
- Bookmark
- Subscribe
- Mute
- Subscribe to RSS Feed
- Permalink
- Report Inappropriate Content
my bad...
I just noticed the KPI indicator visualization...
Shame on me for being so dumb/sloppy.
Thanks guys anyway
- Mark as New
- Bookmark
- Subscribe
- Mute
- Subscribe to RSS Feed
- Permalink
- Report Inappropriate Content
Hi Oliver,
As I mentioned in my post, Create a KPI and add that to your story using Embed sheet option from the story.
Thanks,
Sangram