Unlock a world of possibilities! Login now and discover the exclusive benefits awaiting you.
- Qlik Community
- :
- All Forums
- :
- QlikView App Dev
- :
- Need clarification in List box
- Subscribe to RSS Feed
- Mark Topic as New
- Mark Topic as Read
- Float this Topic for Current User
- Bookmark
- Subscribe
- Mute
- Printer Friendly Page
- Mark as New
- Bookmark
- Subscribe
- Mute
- Subscribe to RSS Feed
- Permalink
- Report Inappropriate Content
Need clarification in List box
Hi,
I m new to Qlikview, kindly help me on the below scenarios,
I have three tables in my data model,
Table 1 Table 2 Table 3
ID TYPE ID CITY ID Name
1 A 1 US 1 JP
2 B 3 JK
3 C
Requirement 1:
Display all the records which does not have city
Requirement 2:
Display all the records which does not have Name
Filter should be ID in list box
I brought all the things in , but i have a problem in list box like when i select the first report , report will have id 2 & 3 since it doesn't have city. But in list box id 1 should be gray color since report 1 is not related to ID 1, i want to display that list box values associated to the charts , but it should be in gray color which is not associated with the reports selected.
Thanks & Regards,
JP
- Mark as New
- Bookmark
- Subscribe
- Mute
- Subscribe to RSS Feed
- Permalink
- Report Inappropriate Content
What are these 'report' things you mention? I don't see them in the example tables you posted.
talk is cheap, supply exceeds demand
- Mark as New
- Bookmark
- Subscribe
- Mute
- Subscribe to RSS Feed
- Permalink
- Report Inappropriate Content
Req1 will be a one report , and req 2 will be a another report . it means 2 charts (table chart) one list box
List box(filter):
ID
1
2
3
Chart 1:
ID TYPE CITY
2 B -
3 C -
So when i see first report , 1 should be in gray color in the list box.
- Mark as New
- Bookmark
- Subscribe
- Mute
- Subscribe to RSS Feed
- Permalink
- Report Inappropriate Content
Hi,
hope this u required,
Tables:
LOAD * INLINE [
ID,  TYPE
1,   A
2,   B
3,    C
];


LOAD * INLINE [
ID,  City
1,   US
2,
3,
];


LOAD * INLINE [
ID,  Name
1,    JP
2,   JK
3,
];
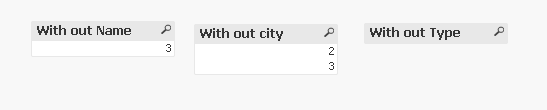
Out put:
in list box Expression,
=IF(Match('',Name),ID)
PFA,
Hirish
“Aspire to Inspire before we Expire!”
- Mark as New
- Bookmark
- Subscribe
- Mute
- Subscribe to RSS Feed
- Permalink
- Report Inappropriate Content
Hi Hiris .. First of all Thank you .. 
My requirement is little different, list box should be dependent with chart values.. list box should contain all the ids but when i select the reports it should display the ids in which are associated to the charts , remaining id should be in gray color
Req1 will be a one report , and req 2 will be a another report . it means 2 charts (table chart) one list box
List box(filter):
ID
1
2
3
Chart 1:
ID TYPE CITY
2 B -
3 C -
So when i see first report , 1 should be in gray color in the list box.
Hope i have explained my situation .. pls help me on this.