Unlock a world of possibilities! Login now and discover the exclusive benefits awaiting you.
- Qlik Community
- :
- All Forums
- :
- QlikView App Dev
- :
- How to count records by group with condition
- Subscribe to RSS Feed
- Mark Topic as New
- Mark Topic as Read
- Float this Topic for Current User
- Bookmark
- Subscribe
- Mute
- Printer Friendly Page
- Mark as New
- Bookmark
- Subscribe
- Mute
- Subscribe to RSS Feed
- Permalink
- Report Inappropriate Content
How to count records by group with condition
Hi, I would like to create a calculated dimension to be able to create a pie graph later on, based on the following:
I have this table:
| ID | GROUP | TYPE |
| 1 | A | X |
| 2 | A | X |
| 3 | A | Y |
| 4 | A | Y |
| 5 | B | X |
| 6 | B | Y |
| 7 | C | X |
| 8 | C | X |
| 9 | C | Y |
I need to count ID's where TYPE = X and create a straight table like this:
| GROUP | VALID |
| A | 2 |
| B | 1 |
| C | 2 |
So I could create a calculated dimension:
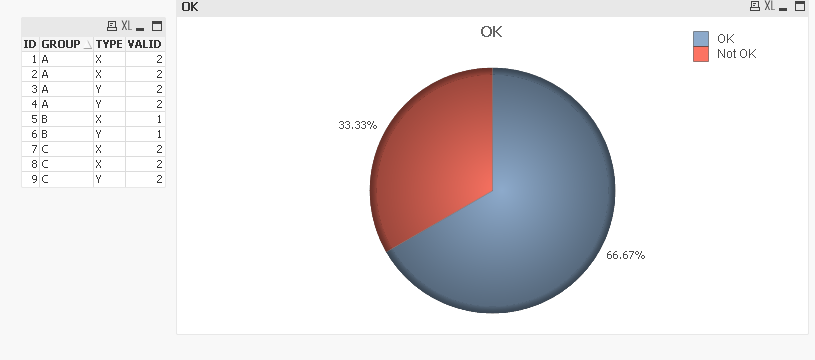
if (valid>1, 'OK', 'Not OK')
and create a pie chart using the calculated dimension. Based on the example, the pie will have 2 slices where 'OK' represents 66.6% and 'Not OK', 33.3%
Many thanks in advance for your help!
Cheers,
Vinia
- Tags:
- new_to_qlikview
Accepted Solutions
- Mark as New
- Bookmark
- Subscribe
- Mute
- Subscribe to RSS Feed
- Permalink
- Report Inappropriate Content
Create a Pie Chart
Dimension (Use Calculated Dimension)
=Aggr(IF(COUNT({<TYPE = {'X'}>}DISTINCT ID)>1,'OK','NOT OK'),GROUP)
Expression
COUNT(DISTINCT GROUP)/COUNT(TOTAL DISTINCT GROUP)
Tick Values on Data Points
Go to Number Tab
Integer
Tick Show in Percent (%)
- Mark as New
- Bookmark
- Subscribe
- Mute
- Subscribe to RSS Feed
- Permalink
- Report Inappropriate Content
May be like attached:
- Mark as New
- Bookmark
- Subscribe
- Mute
- Subscribe to RSS Feed
- Permalink
- Report Inappropriate Content
Create a Pie Chart
Dimension (Use Calculated Dimension)
=Aggr(IF(COUNT({<TYPE = {'X'}>}DISTINCT ID)>1,'OK','NOT OK'),GROUP)
Expression
COUNT(DISTINCT GROUP)/COUNT(TOTAL DISTINCT GROUP)
Tick Values on Data Points
Go to Number Tab
Integer
Tick Show in Percent (%)
- Mark as New
- Bookmark
- Subscribe
- Mute
- Subscribe to RSS Feed
- Permalink
- Report Inappropriate Content
Thank you, Sunny and Manish.
How do I create the straight table as I have mentioned in my original post without having to go to the script editor. Is there a way to do that using an expression?
- Mark as New
- Bookmark
- Subscribe
- Mute
- Subscribe to RSS Feed
- Permalink
- Report Inappropriate Content
My method is for front end only. You don't need to work anything inside script.