Unlock a world of possibilities! Login now and discover the exclusive benefits awaiting you.
- Qlik Community
- :
- All Forums
- :
- QlikView App Dev
- :
- finding the number of active outlets per calenderw...
- Subscribe to RSS Feed
- Mark Topic as New
- Mark Topic as Read
- Float this Topic for Current User
- Bookmark
- Subscribe
- Mute
- Printer Friendly Page
- Mark as New
- Bookmark
- Subscribe
- Mute
- Subscribe to RSS Feed
- Permalink
- Report Inappropriate Content
finding the number of active outlets per calenderweek from a cross table
Hello Qlik Community,
i have a probleme in finding the number of active outlets per calenderweek from a cross table and plotting these datapoints into an existing chart.
I have attached a qvw and excelfile whith detailed explanation of the probleme!
Any help or hint is appreciated 
Accepted Solutions
- Mark as New
- Bookmark
- Subscribe
- Mute
- Subscribe to RSS Feed
- Permalink
- Report Inappropriate Content
Habe mir das jetzt mal gründlicher angesehen und bin mir nicht sicher, ob sich das vernünftig in der Oberfläche lösen lässt. Per Skript ist es jedenfalls recht einfach - min. Datum pro Outlet generieren und an die Hauptabelle ran-joinen und in einem Folge-Load dieses min. Datum mit dem Wochendatum abgleichen und ein Flag dazu generieren. Und den kann man dann in der Oberfläche zählen.
Edit: anstatt des counts geht es bei dem Flag mit summieren natürlich noch einfacher: sum(OutletFlag)
- Marcus
- Mark as New
- Bookmark
- Subscribe
- Mute
- Subscribe to RSS Feed
- Permalink
- Report Inappropriate Content
A crosstable is very inappropriate for the most views. Therefore I suggest you transformed it into a normal table-structure and then you won't have probably no problems to create your chart:
- Marcus
- Mark as New
- Bookmark
- Subscribe
- Mute
- Subscribe to RSS Feed
- Permalink
- Report Inappropriate Content
thank you for your answer, but the problem is, that there are about 300 Outlets in my list, continuing growing!
If i would use a "normal mode" that would take me a lot of time filling up the charts with that bunch of expressions!
I think the easiest option is to modify the dataset within Excel, something like:
- Mark as New
- Bookmark
- Subscribe
- Mute
- Subscribe to RSS Feed
- Permalink
- Report Inappropriate Content
No, I don't think so. After transforming the crosstable you would get such a table-structure:
YearWeek Outlet_ID Value
2016 KW 05 1 100
....
and in your charts you could use a single expression like:
count({< Value = {">0"}>} Outlet_ID)
- Marcus
- Mark as New
- Bookmark
- Subscribe
- Mute
- Subscribe to RSS Feed
- Permalink
- Report Inappropriate Content
Hi Marcus ich versuche es mal auf deutsch!
Meine Datenbasis ist die Exceltabelle, welche ich durch einen externen Export generiert bekomme.
Wie gesagt, die Liste wird immer "breiter", da immer neue Outlets dazukommen (momentan ca. 300).
Würde ich diese Tabelle dann in Qlikview ganz normal einlesen, hätte ich für jedes Outlet ein eigenes Feld!
Da dies jedoch sehr unpraktikabel ist, blieb mir bislang nichts anderes übrig, als einen crosstable zu verwenden!
Dann habe ich ja folgende Struktur:
YearWeek Outlet_ID Value
2016 KW 05 1 100
Für meine Berechnung reicht es jedoch nicht aus, nur Value>0 in Betracht zu ziehen:
count({< Value = {">0"}>} Outlet_ID)
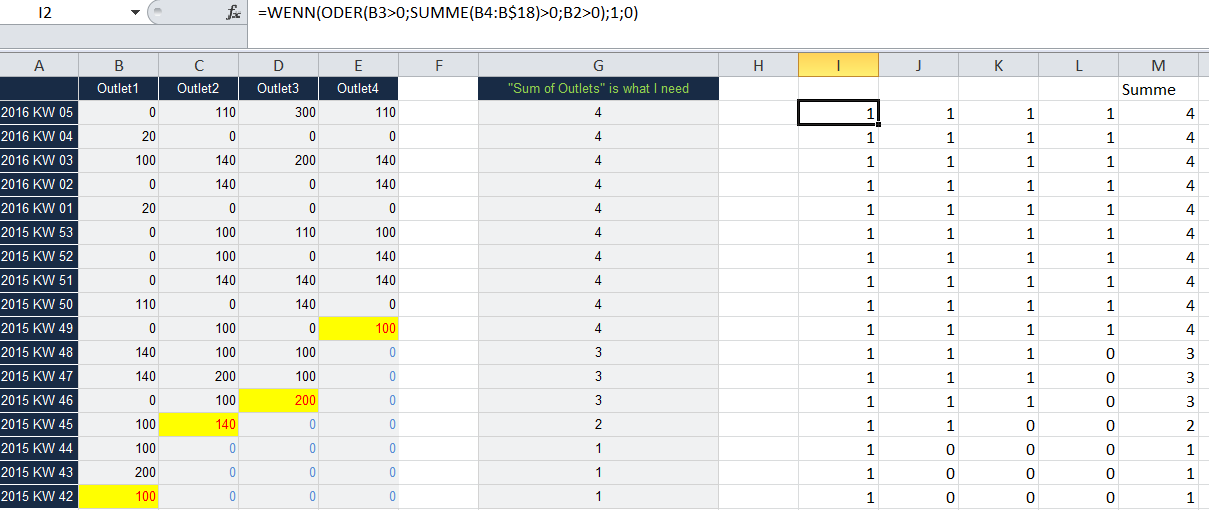
Vielmehr, muss ich irgendwie ein Flag setzten, welches mir sagt, ob der Betrieb in der jeweiligen KW überhaupt schon aktiv war (der Rollout Zeitpunkt ist an den farbigen Farkierungen zu erkennen.) Da aber in meiner Beispiel Excel auch Nullwerte auftauchen können, obwohl der Rollout des Outlets schon längst durchgeführt wurde, müsste ich etwas in Qlikview machen, was
=WENN(ODER(B4>0;SUMME(B5:B$18)>0;B3>0);1;0) entspricht!
Nur wie ich das umsetzten kann ist mir noch nicht ganz klar!
- Mark as New
- Bookmark
- Subscribe
- Mute
- Subscribe to RSS Feed
- Permalink
- Report Inappropriate Content
Hi, Frank Hartmann.
This script is just an idea of how can sum value of data in each field, without cross table.
Therefore, adapt and better inside than you want as a result. See also, if the performance is feasible.
CreateList:
LOAD Concat(chr(39)&F1&chr(39),',') as F1
FROM
[..\Test.xlsx]
(ooxml, embedded labels, table is Tabelle1)
where
isnull(F1) = 0;
LET vList = Peek('F1',0,'CreateList');
DROP Table CreateList;
LET vSum = num(0);
For Each list in $(vList)
Test2:
LOAD
Outlet1,
Outlet2,
Outlet3,
Outlet4
FROM
[..\Test.xlsx]
(ooxml, embedded labels, table is Tabelle1)
where
F1 = '$(list)';
vSum = FieldValue('Outlet1',1) + FieldValue('Outlet2',1) + FieldValue('Outlet3',1) +FieldValue('Outlet4',1);
NewTable:
LOAD
'$(list)' as F1,
'$(vSum)' as DatEn
AutoGenerate 1;
vSum = num(0);
Drop Table Test2;
NEXT;
STORE [NewTable] INTO [..\NewTable.qvd] (qvd);
DROP Table NewTable;
Hope this helps!
- Mark as New
- Bookmark
- Subscribe
- Mute
- Subscribe to RSS Feed
- Permalink
- Report Inappropriate Content
Habe mir das jetzt mal gründlicher angesehen und bin mir nicht sicher, ob sich das vernünftig in der Oberfläche lösen lässt. Per Skript ist es jedenfalls recht einfach - min. Datum pro Outlet generieren und an die Hauptabelle ran-joinen und in einem Folge-Load dieses min. Datum mit dem Wochendatum abgleichen und ein Flag dazu generieren. Und den kann man dann in der Oberfläche zählen.
Edit: anstatt des counts geht es bei dem Flag mit summieren natürlich noch einfacher: sum(OutletFlag)
- Marcus
- Mark as New
- Bookmark
- Subscribe
- Mute
- Subscribe to RSS Feed
- Permalink
- Report Inappropriate Content
Vielen, vielen Dank Marcus. Deine Vorgehensweise schwebte mir auch im Kopf herum. Leider haperte es noch an der Umsetzung.