Unlock a world of possibilities! Login now and discover the exclusive benefits awaiting you.
- Qlik Community
- :
- Forums
- :
- Analytics
- :
- App Development
- :
- How do I forcibly default a chart to display dimen...
- Subscribe to RSS Feed
- Mark Topic as New
- Mark Topic as Read
- Float this Topic for Current User
- Bookmark
- Subscribe
- Mute
- Printer Friendly Page
- Mark as New
- Bookmark
- Subscribe
- Mute
- Subscribe to RSS Feed
- Permalink
- Report Inappropriate Content
How do I forcibly default a chart to display dimensions?
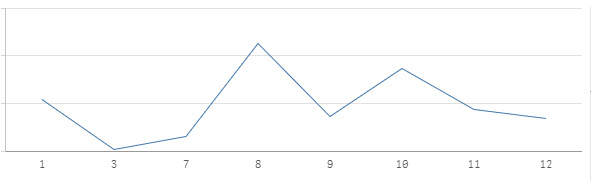
In the example I've included, there are a number of dimensions missing because there are no measures occurring in that dimension. (2, 4, 5, 6).
For the sake of conversation, let's say this line chart counts how many individuals drop out of the process at each step. Let's call it a 12 step program. To do this, my chart is using Dimension =(STEPS), and Measure =COUNT(STEPS) How can I forcibly show that something (even a 0) happened at steps 2, 4, 5, & 6 even if nobody drops out of the process? Is there logic that I can enter into the Dimension that would show 1 2 3 4 5 6 7 8 9 10 11 12 on my chart, but still allow users to filter out any step that they would like?
- Mark as New
- Bookmark
- Subscribe
- Mute
- Subscribe to RSS Feed
- Permalink
- Report Inappropriate Content
Hi,
You can create another table which will have all the values and then you can use that field. For example.
Load STEPS, STEPS as Key From Data;
Load * inline [
Key, ALLSTEPS
1,1
2,2
.....
12,12
];
Now use the AllSTEPS field as dimension.
Regard,
Kaushik Solanki
- Mark as New
- Bookmark
- Subscribe
- Mute
- Subscribe to RSS Feed
- Permalink
- Report Inappropriate Content
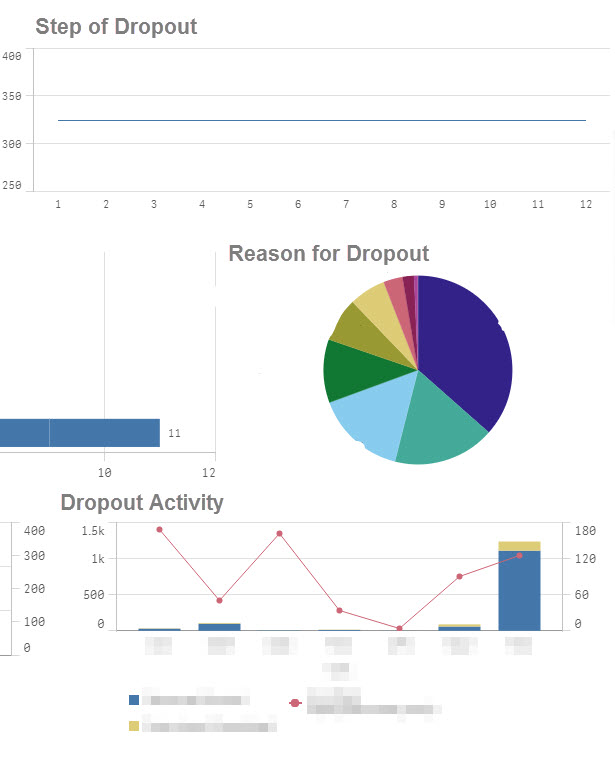
Unfortunately, that doesn't work as other complex charts/visualizations are tied to that same field. It also doesn't appear to count correctly now.
- Mark as New
- Bookmark
- Subscribe
- Mute
- Subscribe to RSS Feed
- Permalink
- Report Inappropriate Content
Hi Isaac,
will something like this work?
Load * inline [
Step, DropOuts
1,1
2,0
3, 2
4, 0
5, 0
6, 0
7, 3
8, 2
9, 1
10, 2
11, 1
12,3
];
Then use "Step" as dimension, and DropOuts as measure.
Regards,
Muliady
- Mark as New
- Bookmark
- Subscribe
- Mute
- Subscribe to RSS Feed
- Permalink
- Report Inappropriate Content
Hi,
can you post the Qvf File.
Regards,
Kaushik Solanki
- Mark as New
- Bookmark
- Subscribe
- Mute
- Subscribe to RSS Feed
- Permalink
- Report Inappropriate Content
Try this: In the charts properties pane on the right, go to Appearance and expand Presentation. Here for missing values select 'Show as zeros' 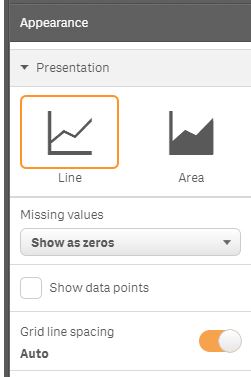
- Mark as New
- Bookmark
- Subscribe
- Mute
- Subscribe to RSS Feed
- Permalink
- Report Inappropriate Content
unfortunately that's not an option for me. The root cause is that I'm using the same field for the dimension and measure, so Qlik doesn't even realize that steps 2, 4, 5, or 6 even exist in this sense.