Unlock a world of possibilities! Login now and discover the exclusive benefits awaiting you.
- Qlik Community
- :
- All Forums
- :
- QlikView App Dev
- :
- How to combine 2 chart into 1 ?
- Subscribe to RSS Feed
- Mark Topic as New
- Mark Topic as Read
- Float this Topic for Current User
- Bookmark
- Subscribe
- Mute
- Printer Friendly Page
- Mark as New
- Bookmark
- Subscribe
- Mute
- Subscribe to RSS Feed
- Permalink
- Report Inappropriate Content
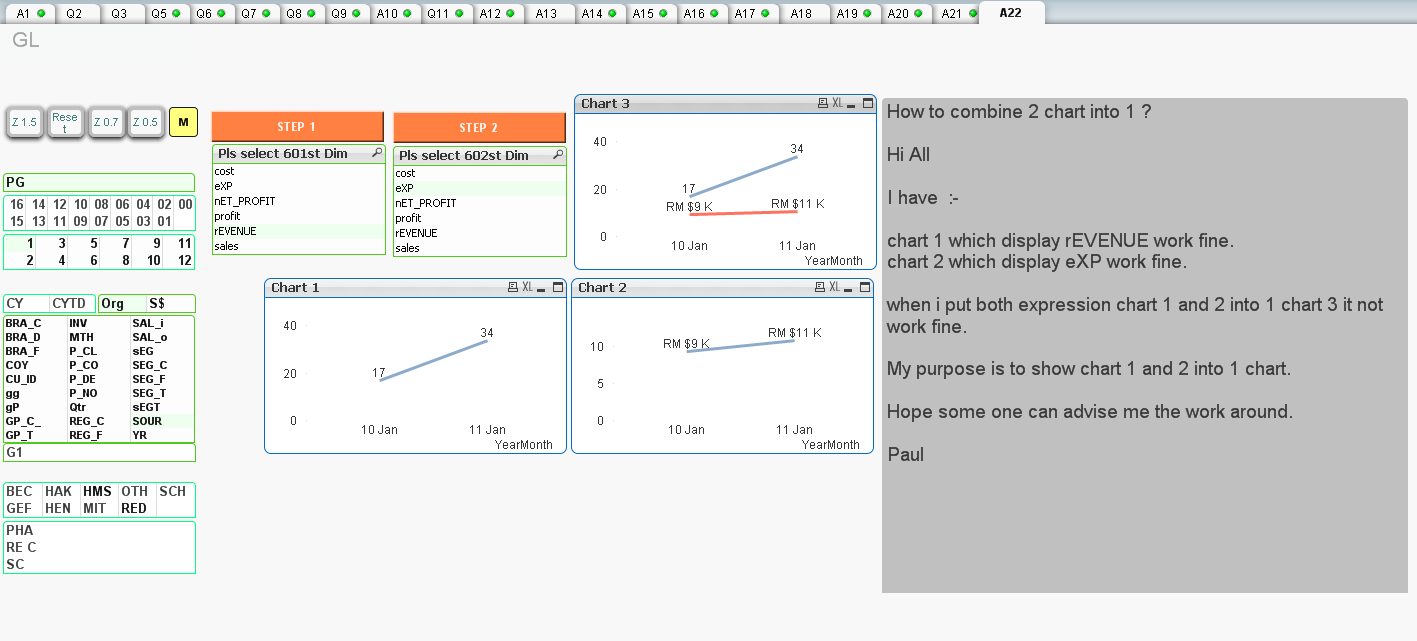
How to combine 2 chart into 1 ?
Hi All
I have :-
chart 1 which display rEVENUE work fine.
chart 2 which display eXP work fine.
when i put both expression chart 1 and 2 into 1 chart 3 it not work fine.
My purpose is to show chart 1 and 2 into 1 chart.
Hope some one can advise me the work around.
Paul
- Tags:
- qlikview_scripting
Accepted Solutions
- Mark as New
- Bookmark
- Subscribe
- Mute
- Subscribe to RSS Feed
- Permalink
- Report Inappropriate Content
If I just open your app, no chart shows data.
If I then select '1' in the list box on the left, all charts show data, and it looks to me that chart 3 shows both chart1 and chart2 data.
Your data model is too complex to dig in easily. If you want more help, I would suggest creating a sample that is less complex.
Best,
Stefan
- Mark as New
- Bookmark
- Subscribe
- Mute
- Subscribe to RSS Feed
- Permalink
- Report Inappropriate Content
Hi Swuehl
Thank you very for your help. After look I turn on year = 2016 , the chart display same as your image. Meaning it work fine now.
To make a simple data structure it is possible , may be I need to use if command to load only sales or GL table. But now I need to settle are reduce no of sheet of my QV Doc.
Any way thank you for your feedback. At lest now my QV Doc file size have reduce a lot.
Paul
Sent from my iPhone