Unlock a world of possibilities! Login now and discover the exclusive benefits awaiting you.
- Qlik Community
- :
- All Forums
- :
- QlikView App Dev
- :
- How to enable CHART PLOT AREA
- Subscribe to RSS Feed
- Mark Topic as New
- Mark Topic as Read
- Float this Topic for Current User
- Bookmark
- Subscribe
- Mute
- Printer Friendly Page
- Mark as New
- Bookmark
- Subscribe
- Mute
- Subscribe to RSS Feed
- Permalink
- Report Inappropriate Content
How to enable CHART PLOT AREA
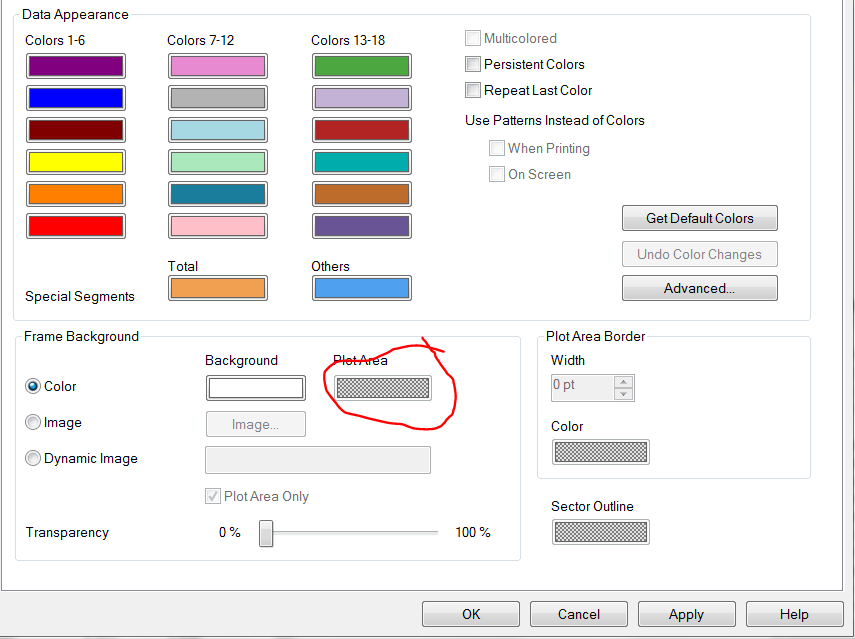
From the pic below: I want to have the plot area of my Line chart diff from the back ground color. I am using an image saved externally to have this effect. Instead I want to use the plot area feature in the COLOrs tab. But it seems its not being enabled. how to do that.
Accepted Solutions
- Mark as New
- Bookmark
- Subscribe
- Mute
- Subscribe to RSS Feed
- Permalink
- Report Inappropriate Content
Try setting the 'Plot Area Background Style' to 'Frame' on Style tab of chart properties.
- Mark as New
- Bookmark
- Subscribe
- Mute
- Subscribe to RSS Feed
- Permalink
- Report Inappropriate Content
I am using more than 10 expressions. read some where multicoloring coption is not avail in charts with more than single expns.
- Mark as New
- Bookmark
- Subscribe
- Mute
- Subscribe to RSS Feed
- Permalink
- Report Inappropriate Content
Try setting the 'Plot Area Background Style' to 'Frame' on Style tab of chart properties.
- Mark as New
- Bookmark
- Subscribe
- Mute
- Subscribe to RSS Feed
- Permalink
- Report Inappropriate Content
the Magic of Swuehl twinkles again! that was it.
Thank you Stephan