Unlock a world of possibilities! Login now and discover the exclusive benefits awaiting you.
- Qlik Community
- :
- All Forums
- :
- QlikView App Dev
- :
- Set analysis expression as dynamic max in line gra...
- Subscribe to RSS Feed
- Mark Topic as New
- Mark Topic as Read
- Float this Topic for Current User
- Bookmark
- Subscribe
- Mute
- Printer Friendly Page
- Mark as New
- Bookmark
- Subscribe
- Mute
- Subscribe to RSS Feed
- Permalink
- Report Inappropriate Content
Set analysis expression as dynamic max in line graph?!?
Hi all,
In my line graph I plot according to this expression:
sum ({1<[Schadecategorie] = {'A','B','C','D','E','F','G','H'}>} [Reserve bedrag in €] / 1000000)
I thought that a clever way of making sure the graph would always display properly, was making use of this expression:
max(aggr(sum({1 <[Schadecategorie] = {'A','B','C','D','E','F','G','H'}>}[Reserve bedrag in €] / 1000000),Peildatum))
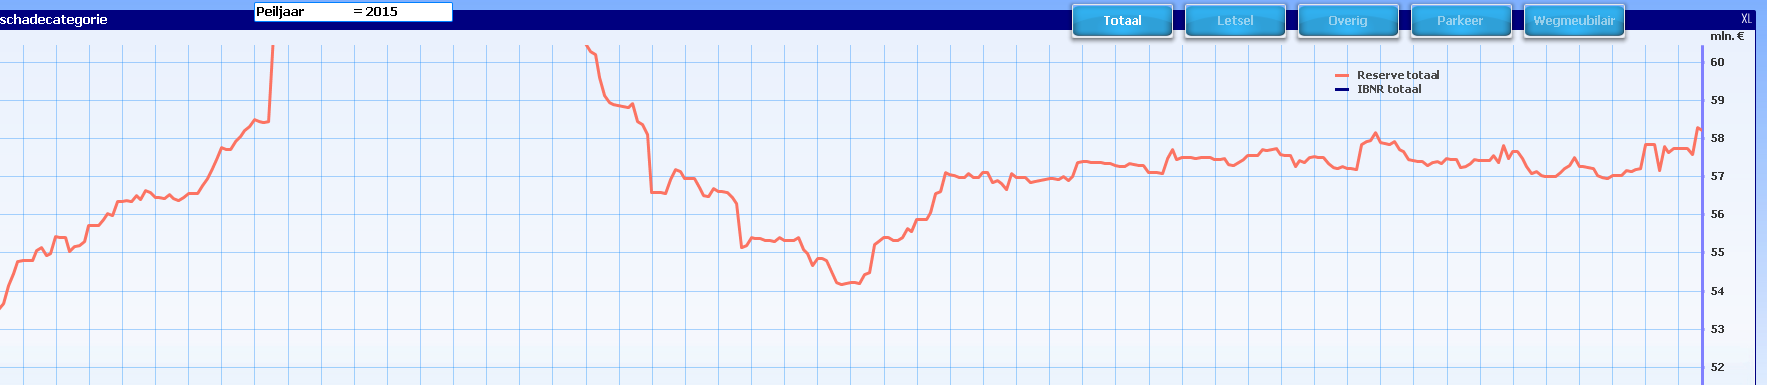
But for some reason, the line goes above (and out of) the chart. Dimension in this chart is Peildatum.
When I add 4.5 mln. to the max() expression, it's OK. What am I doing wrong?
- « Previous Replies
- Next Replies »
Accepted Solutions
- Mark as New
- Bookmark
- Subscribe
- Mute
- Subscribe to RSS Feed
- Permalink
- Report Inappropriate Content
Ok, I see what the problem is. You're messing around with min and max settings for the x-axis.  The chart actually contains more data, but doesn't show it. And you're using {1} in your expressions to overrule the selections of Peildatum and Peiljaar. That needs to be added to the expression to calculate the max value for the y-axis:
=max({<Peildatum, Peiljaar={$(vPeiljaar)}>}aggr(
sum({1 <[Schadecategorie] = {'A','B','C','D','E','F','G','H'}>}[Reserve bedrag in €] / 1000000)
,Peildatum))
talk is cheap, supply exceeds demand
- Mark as New
- Bookmark
- Subscribe
- Mute
- Subscribe to RSS Feed
- Permalink
- Report Inappropriate Content
could you please share the problem screen shots
- Mark as New
- Bookmark
- Subscribe
- Mute
- Subscribe to RSS Feed
- Permalink
- Report Inappropriate Content
- Mark as New
- Bookmark
- Subscribe
- Mute
- Subscribe to RSS Feed
- Permalink
- Report Inappropriate Content
If you're using more dimensions in your chart then just Peildatum then include the other dimension(s) in the aggr as well.
max(aggr(sum({1 <[Schadecategorie] = {'A','B','C','D','E','F','G','H'}>}[Reserve bedrag in €] / 1000000),Peildatum, DimX))
talk is cheap, supply exceeds demand
- Mark as New
- Bookmark
- Subscribe
- Mute
- Subscribe to RSS Feed
- Permalink
- Report Inappropriate Content
Hi Gysbert,
No - Peildatum is the only dimension. I use $(vPeiljaar) to show only Peildatum for a certain Peiljaar (also a field in my master calendar), but the x-axis is Peildatum...
- Mark as New
- Bookmark
- Subscribe
- Mute
- Subscribe to RSS Feed
- Permalink
- Report Inappropriate Content
I was afraid of that
Can you post a small qlikview document that illustrates the problem. See this document for how to do that safely: Preparing examples for Upload - Reduction and Data Scrambling
talk is cheap, supply exceeds demand
- Mark as New
- Bookmark
- Subscribe
- Mute
- Subscribe to RSS Feed
- Permalink
- Report Inappropriate Content
Uhm, reducing data messed it up seriously. I'm willing to PM / mail it to you, but I don't think I should post it here.. (It's about 18 Mb)
- Mark as New
- Bookmark
- Subscribe
- Mute
- Subscribe to RSS Feed
- Permalink
- Report Inappropriate Content
Well, the max upload limit is 300 MB  . So 18 MB is ok.
talk is cheap, supply exceeds demand
- Mark as New
- Bookmark
- Subscribe
- Mute
- Subscribe to RSS Feed
- Permalink
- Report Inappropriate Content
Can I PM it? And if yes, how? (Still new on this forum...)
- Mark as New
- Bookmark
- Subscribe
- Mute
- Subscribe to RSS Feed
- Permalink
- Report Inappropriate Content
I thought I'd be able to pm you when we started "following" each other. But that doesn't seem to be the case. Let's try LinkedIn. If you have a LinkedIn profile you shouldn't have any trouble finding me there. The number of Hans de Vries'en on LinkedIn is rather large... So, I have no idea which one those you might be
talk is cheap, supply exceeds demand
- « Previous Replies
- Next Replies »