Unlock a world of possibilities! Login now and discover the exclusive benefits awaiting you.
- Qlik Community
- :
- Forums
- :
- Analytics
- :
- App Development
- :
- how to create pie chart with multiple measures
- Subscribe to RSS Feed
- Mark Topic as New
- Mark Topic as Read
- Float this Topic for Current User
- Bookmark
- Subscribe
- Mute
- Printer Friendly Page
- Mark as New
- Bookmark
- Subscribe
- Mute
- Subscribe to RSS Feed
- Permalink
- Report Inappropriate Content
how to create pie chart with multiple measures
Hi,
I have a measure name AMOUNT from raw data .then i have calculated three calculated measures named CalcA,CalcB,CalcC from AMOUNT and I want to create a pie chart with these three calculated measures only. I don't want to take any dimension for this pie chart. The requirement is there will be a pie chart which shows three section of Amount and section name will be like CalcA=20%, CalcB=70%,CalcC=10%.Can Anyone please help me in this problem
- Tags:
- custom pie chart
- « Previous Replies
-
- 1
- 2
- Next Replies »
- Mark as New
- Bookmark
- Subscribe
- Mute
- Subscribe to RSS Feed
- Permalink
- Report Inappropriate Content
CalcA, CalcB and CalcC are fixed? Do you have a sample you can share?
- Mark as New
- Bookmark
- Subscribe
- Mute
- Subscribe to RSS Feed
- Permalink
- Report Inappropriate Content
Let me explain what are these measures
Customer Region Sales
A Delhi 10
B Mumbai 20
C New York 30
D Sydney 30
E Bangkok 30
F Singapore 50
CalA= Sum({$<customer={"A","B"},Region={"Delhi ","Bangkok"}>}Amount)
For the same manner CalB and CalC are measured.
Now i want create a pie chart which shows the share of amount basis of CalcA,CalcB,CalcC
For Example : one section will show
Name= CalA
Value = 30%
- Mark as New
- Bookmark
- Subscribe
- Mute
- Subscribe to RSS Feed
- Permalink
- Report Inappropriate Content
sample bellow .
- Mark as New
- Bookmark
- Subscribe
- Mute
- Subscribe to RSS Feed
- Permalink
- Report Inappropriate Content
Something like this?
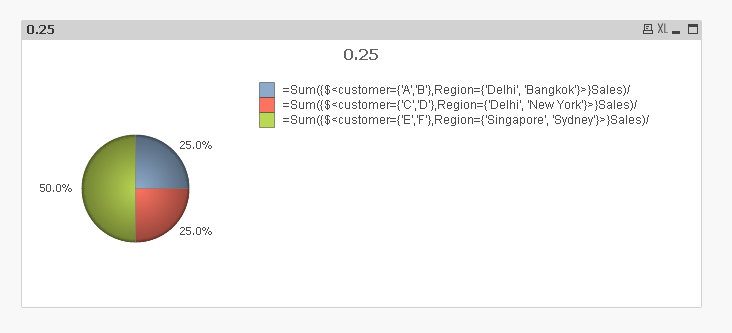
Expression1
Expression1/RangeSum(Expression1, Expression2, Expression3)
Expression2
Expression2/RangeSum(Expression1, Expression2, Expression3)
Expression3
Expression3/RangeSum(Expression1, Expression2, Expression3)
- Mark as New
- Bookmark
- Subscribe
- Mute
- Subscribe to RSS Feed
- Permalink
- Report Inappropriate Content
Hi,
I agree above your solution will give three new calculated measures Expression1,Expression2,Expression3. So can you please tell me how to use these three measures to create a pie chart as what the default condition I can use only one dimension and one measure for pie chart.
Secondly the qvf file you have attached has same sample data in script writer tab. Can you please tell me what is the purpose of attached file . Sorry may be i couldn't find the use of it.
- Mark as New
- Bookmark
- Subscribe
- Mute
- Subscribe to RSS Feed
- Permalink
- Report Inappropriate Content
Dear Rohit,
You are right you can use the one expression when you are having any dimension.
If you do not have dimension then you can have multiple expression to make a pie chart.
Using same concept experts has given you the solution.
Regards,
Kaushik Solanki
- Mark as New
- Bookmark
- Subscribe
- Mute
- Subscribe to RSS Feed
- Permalink
- Report Inappropriate Content
Hi Kaushik,
Here the case is i have only three calculated measures not any dimension. So as you stated above, how can i use multiple calculated measures to form a PIE chart. while i am creating it , it ask one dim and one measure and when i try to drag second measure it ask for replace first one or cancel. Can you please help me how to select multiple measure while creating pie chart
- Mark as New
- Bookmark
- Subscribe
- Mute
- Subscribe to RSS Feed
- Permalink
- Report Inappropriate Content
Hi AHID,
while i am trying to open your attached file , it is saying file contain no data and when i am checking in scripting part there is also nothing. May be i am opening it with wrong manner, can u please help me to guide how to open your attached file
- Mark as New
- Bookmark
- Subscribe
- Mute
- Subscribe to RSS Feed
- Permalink
- Report Inappropriate Content
Hi Rohit,
I got what you are looking for.
You are right. Actually you are looking for a pie chart in Qlik Sense and not in Qlik View.
Till now we were talking about Qlik View and not Qlik Sense.
As of now Qlik Sense do not allow multiple expressions by default.
If you want to achieve this then only way is to make your own extension and use it.
Regards,
Kaushik Solanki
- « Previous Replies
-
- 1
- 2
- Next Replies »