Unlock a world of possibilities! Login now and discover the exclusive benefits awaiting you.
- Qlik Community
- :
- All Forums
- :
- QlikView App Dev
- :
- Chart accumulation last 5 values but consider alla...
- Subscribe to RSS Feed
- Mark Topic as New
- Mark Topic as Read
- Float this Topic for Current User
- Bookmark
- Subscribe
- Mute
- Printer Friendly Page
- Mark as New
- Bookmark
- Subscribe
- Mute
- Subscribe to RSS Feed
- Permalink
- Report Inappropriate Content
Chart accumulation last 5 values but consider alla values
Dear Experts,
I’ve a problem with a chart, in the attached picture I try to show my question.
In the chart I’ve in the X axis there are weeks from the begin of the year and in the Y axis there are some values that I want to show “accumulate”.
I’cant show only the 10 or 8 last values but I want to have consider all the values from the begin of the year.
Thanks in advance
Bye Angelo
P.S. I have attached the picture I have and the picture I want.
- Mark as New
- Bookmark
- Subscribe
- Mute
- Subscribe to RSS Feed
- Permalink
- Report Inappropriate Content
Can you please share the sample qvw ?
- Mark as New
- Bookmark
- Subscribe
- Mute
- Subscribe to RSS Feed
- Permalink
- Report Inappropriate Content
How you are getting your accumulated value?
If it's derived from Script, you can use the 'Dimension Limit' for Top 10 or 8 values
- Mark as New
- Bookmark
- Subscribe
- Mute
- Subscribe to RSS Feed
- Permalink
- Report Inappropriate Content
What is your chart expression?
- Mark as New
- Bookmark
- Subscribe
- Mute
- Subscribe to RSS Feed
- Permalink
- Report Inappropriate Content
Here the ezample.
Bye Angelo
- Mark as New
- Bookmark
- Subscribe
- Mute
- Subscribe to RSS Feed
- Permalink
- Report Inappropriate Content
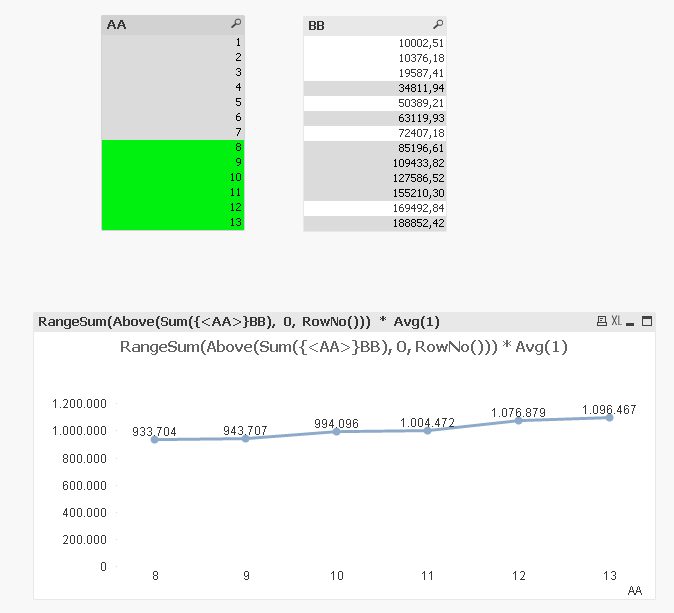
Expression:
RangeSum(Above(Sum({<AA>}BB), 0, RowNo())) * Avg(1)
- Mark as New
- Bookmark
- Subscribe
- Mute
- Subscribe to RSS Feed
- Permalink
- Report Inappropriate Content
Thanks you saved me !!!
Bye Angelo