Unlock a world of possibilities! Login now and discover the exclusive benefits awaiting you.
- Qlik Community
- :
- All Forums
- :
- QlikView App Dev
- :
- Cumulative Total by User, Stacked Bar Chart
- Subscribe to RSS Feed
- Mark Topic as New
- Mark Topic as Read
- Float this Topic for Current User
- Bookmark
- Subscribe
- Mute
- Printer Friendly Page
- Mark as New
- Bookmark
- Subscribe
- Mute
- Subscribe to RSS Feed
- Permalink
- Report Inappropriate Content
Cumulative Total by User, Stacked Bar Chart
Hi All,
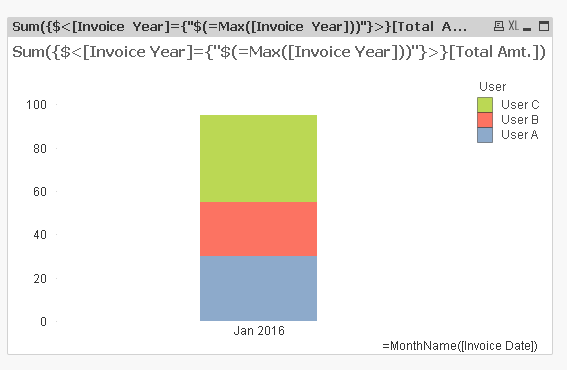
I'm attempting to create a stacked bar chart as attached drawing.
I have 'Invoice Date' as a dimension displayed as Month Year and I'm trying to show Total Amount accumulated by user per month as an expression.
I've defined it as follows, but I'm not getting the desired results. I'm Probably going about it the wrong way.
=aggr(Sum({$<[Invoice Year]={"$(=Max([Invoice Year]))"}>}[Total Amt.]), [User Name]))
Example Data:
Invoice Date | Department | User | Total Amt. |
01/01/2016 | Operations | User A | £10
01/01/2016 | Operations | User B | £15
01/01/2016 | IT | User C | £30
01/02/2016 | Operations | User A | £20
01/02/2016 | Operations | User B | £10
01/02/2016 | IT | User C | £10
Can anyone help point me on the right path?
Thanks,
Accepted Solutions
- Mark as New
- Bookmark
- Subscribe
- Mute
- Subscribe to RSS Feed
- Permalink
- Report Inappropriate Content
- Mark as New
- Bookmark
- Subscribe
- Mute
- Subscribe to RSS Feed
- Permalink
- Report Inappropriate Content
Hi,
please see the attachment.
is that what you are looking for?
Ariel
- Mark as New
- Bookmark
- Subscribe
- Mute
- Subscribe to RSS Feed
- Permalink
- Report Inappropriate Content
Like this?
- Mark as New
- Bookmark
- Subscribe
- Mute
- Subscribe to RSS Feed
- Permalink
- Report Inappropriate Content
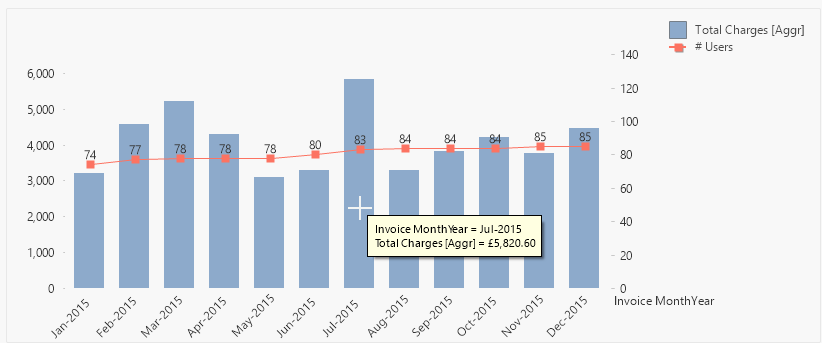
Yes, I think so Sunny
So the end result would look like as below but split by user for each month as you have above
- Mark as New
- Bookmark
- Subscribe
- Mute
- Subscribe to RSS Feed
- Permalink
- Report Inappropriate Content
Right now we only have one month of data that you have provided. I guess can you try the above example on your end and see if this is working for you or not?
- Mark as New
- Bookmark
- Subscribe
- Mute
- Subscribe to RSS Feed
- Permalink
- Report Inappropriate Content
Thanks Sunny