Unlock a world of possibilities! Login now and discover the exclusive benefits awaiting you.
- Qlik Community
- :
- All Forums
- :
- QlikView App Dev
- :
- Issue in combo chart while shoiwng negative values...
- Subscribe to RSS Feed
- Mark Topic as New
- Mark Topic as Read
- Float this Topic for Current User
- Bookmark
- Subscribe
- Mute
- Printer Friendly Page
- Mark as New
- Bookmark
- Subscribe
- Mute
- Subscribe to RSS Feed
- Permalink
- Report Inappropriate Content
Issue in combo chart while shoiwng negative values using Axes
Hello,
I need one help.
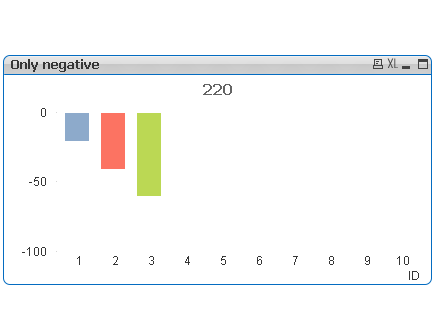
I am having one issue while I am trying to show the bar negative and positive values using Chart Axes property (Scale Static Min and Static Max). I have given functionality to user where user can select the Axes range from slider and it will show the data based on the axes limit set by user. I have created sample file with I put static Min and Static max value in charts . for Only Positive chart it is showing only positive bars but for negative it is showing both. So is there any way we can show only negative bars without make any changes in expression. The reason is I am using dynamic and multiple selection of dimensions.
Thanks in Advance.
- Mark as New
- Bookmark
- Subscribe
- Mute
- Subscribe to RSS Feed
- Permalink
- Report Inappropriate Content
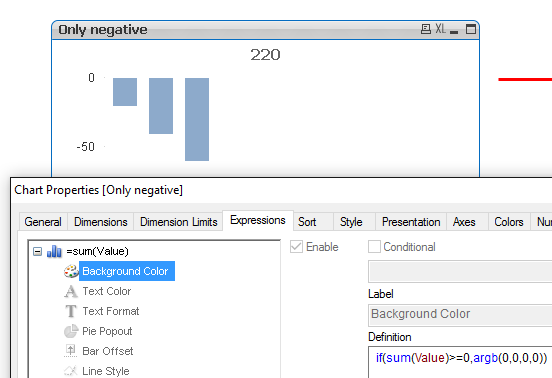
Click on the + in front of the expression, choose Background Color and enter an expression to make the bar transparent if its value is larger or equal to 0:
talk is cheap, supply exceeds demand
- Mark as New
- Bookmark
- Subscribe
- Mute
- Subscribe to RSS Feed
- Permalink
- Report Inappropriate Content
Hi,
May be like this,
=If(sum(Value)<0,Sum(Value))
By taking the values which are than less than zero,
Hope this helps,
PFA,
Hirish
“Aspire to Inspire before we Expire!”