Unlock a world of possibilities! Login now and discover the exclusive benefits awaiting you.
- Qlik Community
- :
- All Forums
- :
- QlikView App Dev
- :
- Need help to add target line in Bar chart.
- Subscribe to RSS Feed
- Mark Topic as New
- Mark Topic as Read
- Float this Topic for Current User
- Bookmark
- Subscribe
- Mute
- Printer Friendly Page
- Mark as New
- Bookmark
- Subscribe
- Mute
- Subscribe to RSS Feed
- Permalink
- Report Inappropriate Content
Need help to add target line in Bar chart.
Hi all,
Hope all of you are doing good. I am new to QlikView and I got a requirement to plot a graph for Sales by product.
I need to add target line for the following chart.
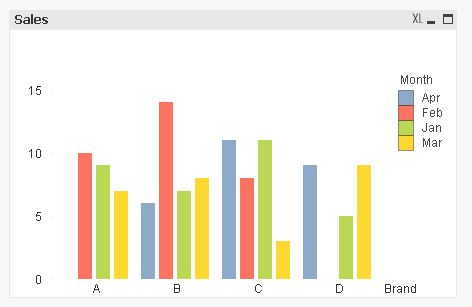
Target for each brand varies as below :
| Brand | Target |
|---|---|
| A | 9 |
| B | 7 |
| C | 8 |
| D | 6 |
Please find the attached QlikView application. Any suggestions will be much appreciated.
Thanks,
Afaque
- Mark as New
- Bookmark
- Subscribe
- Mute
- Subscribe to RSS Feed
- Permalink
- Report Inappropriate Content
load Target for each brand as an inline load:
load * INLINE [
Brand,Target
A, 9
B ,7
C, 8
D, 6
];
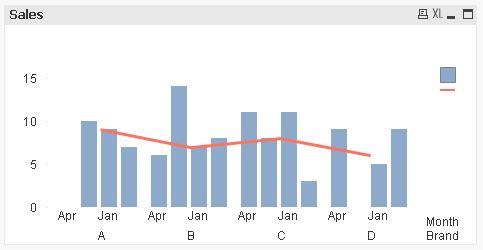
use combo chart.
add another expression to chart as sum(target)
in display option for second expression unselect bar and select line.
Khushboo
- Mark as New
- Bookmark
- Subscribe
- Mute
- Subscribe to RSS Feed
- Permalink
- Report Inappropriate Content
See this link https://community.qlik.com/message/566974#566974
Vikas
If the issue is solved please mark the answer with Accept as Solution & like it.
If you want to go quickly, go alone. If you want to go far, go together.
- Mark as New
- Bookmark
- Subscribe
- Mute
- Subscribe to RSS Feed
- Permalink
- Report Inappropriate Content
Hi Khushboo,
Thanks for the suggestion. But after applying your solution, I got this
But as per my requirement the chart should look like this (This chart is plotted in Excel)
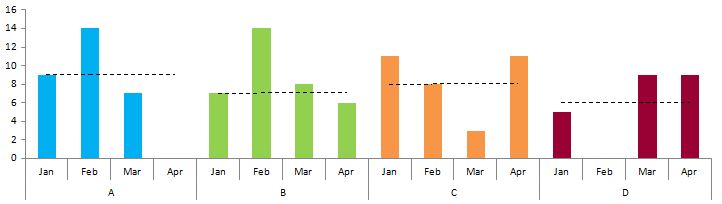
So any further guidance will be much appreciated.
Regards,
Afaque
- Mark as New
- Bookmark
- Subscribe
- Mute
- Subscribe to RSS Feed
- Permalink
- Report Inappropriate Content
Thanks for the reference link.
- Mark as New
- Bookmark
- Subscribe
- Mute
- Subscribe to RSS Feed
- Permalink
- Report Inappropriate Content
Any one out there Who can help me in this.