Unlock a world of possibilities! Login now and discover the exclusive benefits awaiting you.
- Qlik Community
- :
- All Forums
- :
- QlikView App Dev
- :
- Bar Stack Chart How To make % amount display on th...
Options
- Subscribe to RSS Feed
- Mark Topic as New
- Mark Topic as Read
- Float this Topic for Current User
- Bookmark
- Subscribe
- Mute
- Printer Friendly Page
Turn on suggestions
Auto-suggest helps you quickly narrow down your search results by suggesting possible matches as you type.
Showing results for
Master
2016-05-26
07:29 PM
- Mark as New
- Bookmark
- Subscribe
- Mute
- Subscribe to RSS Feed
- Permalink
- Report Inappropriate Content
Bar Stack Chart How To make % amount display on the Bar ?
Hi All
I need to achieve the above. I have did it few year back , and forgotten how to do it again,
Paul
- Tags:
- qlikview_scripting
320 Views
1 Solution
Accepted Solutions
Anonymous
Not applicable
2016-05-26
07:49 PM
- Mark as New
- Bookmark
- Subscribe
- Mute
- Subscribe to RSS Feed
- Permalink
- Report Inappropriate Content
Hi paul,
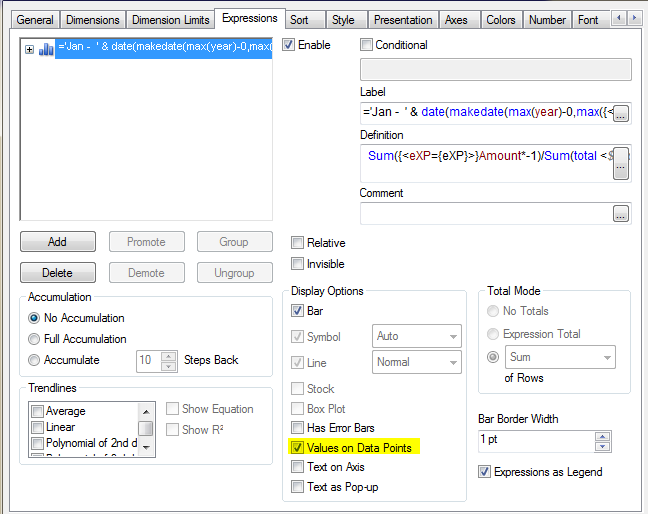
In expressions, select Values on Data Points:
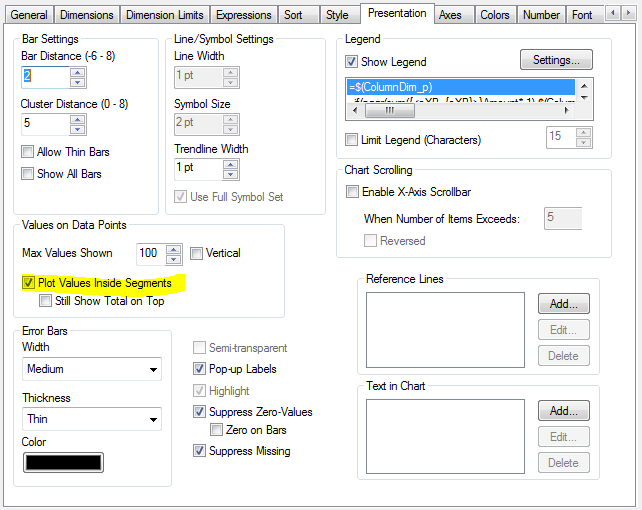
And next, in Presentation tab check Plot Values Inside Segments:
Regards,
-- Karla
256 Views
5 Replies
Master
2016-05-26
07:29 PM
Author
- Mark as New
- Bookmark
- Subscribe
- Mute
- Subscribe to RSS Feed
- Permalink
- Report Inappropriate Content
my QV Doc
256 Views
MVP
2016-05-26
07:43 PM
- Mark as New
- Bookmark
- Subscribe
- Mute
- Subscribe to RSS Feed
- Permalink
- Report Inappropriate Content
Not seeing what is not working for you?
256 Views
Anonymous
Not applicable
2016-05-26
07:49 PM
- Mark as New
- Bookmark
- Subscribe
- Mute
- Subscribe to RSS Feed
- Permalink
- Report Inappropriate Content
Hi paul,
In expressions, select Values on Data Points:
And next, in Presentation tab check Plot Values Inside Segments:
Regards,
-- Karla
257 Views
Master
2016-05-26
08:10 PM
Author
- Mark as New
- Bookmark
- Subscribe
- Mute
- Subscribe to RSS Feed
- Permalink
- Report Inappropriate Content
Hi Sunny , on my QV i see no % display , because i never tick at presentation Tab as mentioned by Mr karta.

256 Views
Master
2016-05-26
08:11 PM
Author
- Mark as New
- Bookmark
- Subscribe
- Mute
- Subscribe to RSS Feed
- Permalink
- Report Inappropriate Content
Hi Karla
Thank you very much , now working fine.
Paul