Unlock a world of possibilities! Login now and discover the exclusive benefits awaiting you.
- Qlik Community
- :
- All Forums
- :
- Qlik NPrinting
- :
- Creating a line chart in Nprinting
- Subscribe to RSS Feed
- Mark Topic as New
- Mark Topic as Read
- Float this Topic for Current User
- Bookmark
- Subscribe
- Mute
- Printer Friendly Page
- Mark as New
- Bookmark
- Subscribe
- Mute
- Subscribe to RSS Feed
- Permalink
- Report Inappropriate Content
Creating a line chart in Nprinting
I am working on a PixelPerfect report and I want to display a line chart. But when I create the preview, it does not display any data.
However, when I insert the table at the bottom of the template and look at the preview, it does display the data but not in the PDF preview.
Can anybody help me? I want to create a PDF file with the data and without the table.

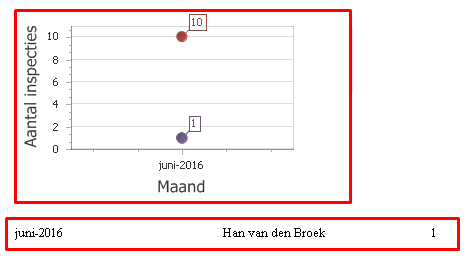
Figure 1: The preview in PDF with the table at the bottom

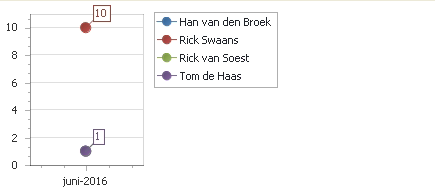
Figure 2: The preview in PNG with the table at the bottom

Figure 3: The preview in PNG without the table at the bottom
- Mark as New
- Bookmark
- Subscribe
- Mute
- Subscribe to RSS Feed
- Permalink
- Report Inappropriate Content
Hi Rick,
Not sure what you mean by 'table at the bottom'. Could you post a screenshot? Better still, attach a sample QVW and a mockup report of what you are after.
Best,
Daniel.
- Mark as New
- Bookmark
- Subscribe
- Mute
- Subscribe to RSS Feed
- Permalink
- Report Inappropriate Content
Hi Daniel,
What I mean by 'table at the bottom' is that i added the table with the data I want to display in the chart to the template, like the figure below.

When I open the PNG preview it displays the following image
As you can see, there are two elements that are displayed. The first is the chart and the second is a table.
What I want is the following:
What I want is that only the chart is shown in the report and not the table.
But when I remove the table from the template like the figure below
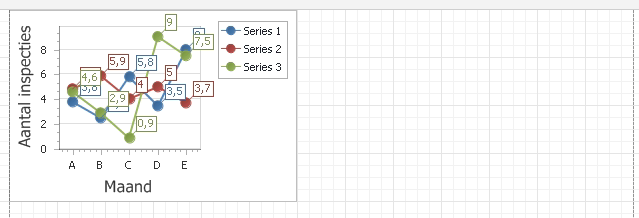
It does not display any data in my chart, as shown below

And with the PDF preview, it does not show any data at all.