Unlock a world of possibilities! Login now and discover the exclusive benefits awaiting you.
- Qlik Community
- :
- All Forums
- :
- QlikView App Dev
- :
- Show values on the bar chart
- Subscribe to RSS Feed
- Mark Topic as New
- Mark Topic as Read
- Float this Topic for Current User
- Bookmark
- Subscribe
- Mute
- Printer Friendly Page
- Mark as New
- Bookmark
- Subscribe
- Mute
- Subscribe to RSS Feed
- Permalink
- Report Inappropriate Content
Show values on the bar chart
Hi, all
I am trying to mark values on my stack value. I know there is an checkbox named "values on the data point" under expression front but it does not work.
My stack bar chart has three colors on each bar. let's say blue(3 counts), red(4 counts), yellow(2 counts). I want to show the number 3,4,2 on the bars. Just like:

Can this be done in Qlikview?
Best and Thank you.
Accepted Solutions
- Mark as New
- Bookmark
- Subscribe
- Mute
- Subscribe to RSS Feed
- Permalink
- Report Inappropriate Content
Hi
Have you checked this as well?
Presentation...>Value on Data points...>(check)Vertical...>(check) plot inside segements
- Mark as New
- Bookmark
- Subscribe
- Mute
- Subscribe to RSS Feed
- Permalink
- Report Inappropriate Content
Can you please share a small sample....
- Mark as New
- Bookmark
- Subscribe
- Mute
- Subscribe to RSS Feed
- Permalink
- Report Inappropriate Content
Hi
Have you checked this as well?
Presentation...>Value on Data points...>(check)Vertical...>(check) plot inside segements
- Mark as New
- Bookmark
- Subscribe
- Mute
- Subscribe to RSS Feed
- Permalink
- Report Inappropriate Content
yes it is possible. sometimes if the numbers in the stack varies a lot then the lower one might get hidden the way it is displayed in your image.
- Mark as New
- Bookmark
- Subscribe
- Mute
- Subscribe to RSS Feed
- Permalink
- Report Inappropriate Content
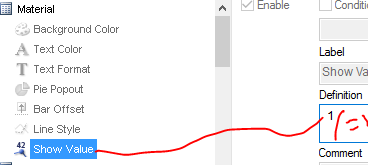
Bar chart have the Access those Data points. If still doesn't work other way is this
Show Value Definition is Should be 1 / =1
- Mark as New
- Bookmark
- Subscribe
- Mute
- Subscribe to RSS Feed
- Permalink
- Report Inappropriate Content
Yes, this works.
Do you know how to change the color and font for these numbers?
Thank you!
- Mark as New
- Bookmark
- Subscribe
- Mute
- Subscribe to RSS Feed
- Permalink
- Report Inappropriate Content
Expand the Expression within the Chart Properties and there are different formatting options available. You can change the font color within the Text Color and use the Text Format to change it to be bold, italics, etc.