Unlock a world of possibilities! Login now and discover the exclusive benefits awaiting you.
- Qlik Community
- :
- All Forums
- :
- QlikView App Dev
- :
- how to make a chart like this
- Subscribe to RSS Feed
- Mark Topic as New
- Mark Topic as Read
- Float this Topic for Current User
- Bookmark
- Subscribe
- Mute
- Printer Friendly Page
- Mark as New
- Bookmark
- Subscribe
- Mute
- Subscribe to RSS Feed
- Permalink
- Report Inappropriate Content
how to make a chart like this
Hi all:
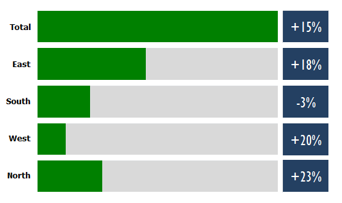
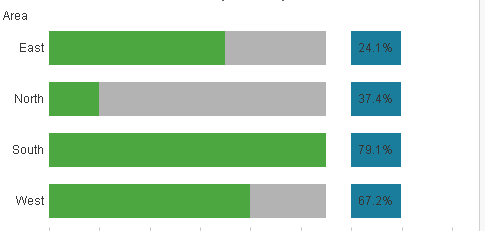
I have a problem that I need a chart like below in qlikview with data in the attachment.
Could anyone help me to get it?
ps: maybe need drill down with field Area. ( like city ,etc )
- « Previous Replies
- Next Replies »
Accepted Solutions
- Mark as New
- Bookmark
- Subscribe
- Mute
- Subscribe to RSS Feed
- Permalink
- Report Inappropriate Content
Hi there,
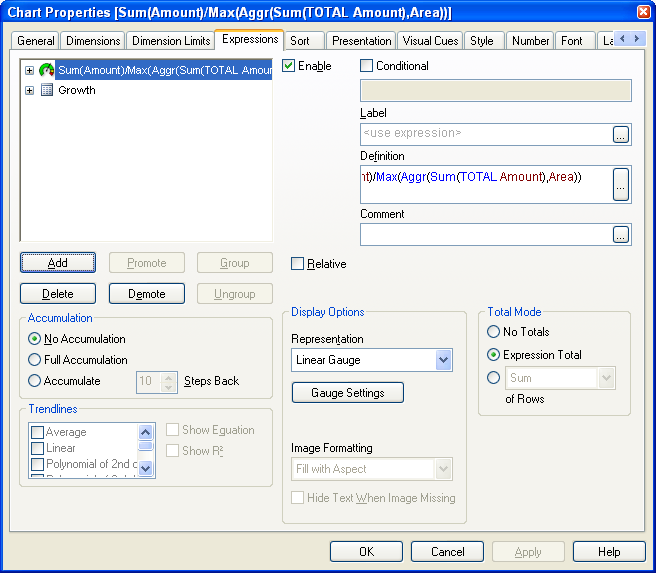
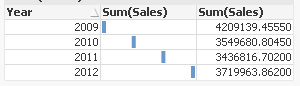
You can create a straight table with an expression like below:
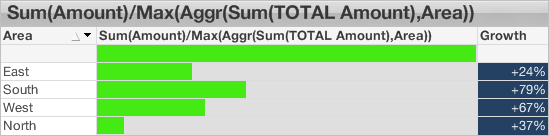
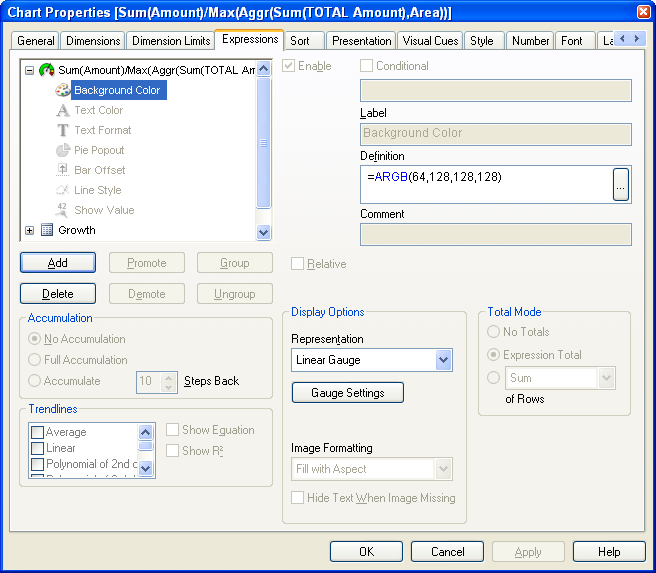
In the chart properties choose Linear Gauge as the Display Option Representation
Set up the gauge properties like this:
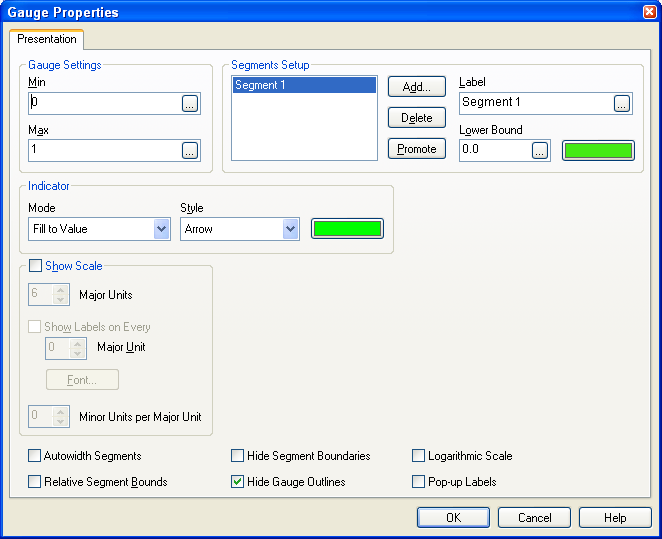
Set the background colour to ARGB(64,128,128,128):
- Mark as New
- Bookmark
- Subscribe
- Mute
- Subscribe to RSS Feed
- Permalink
- Report Inappropriate Content
HI,
There is no chart which will give you both combination, but here is the work around.
Regards,
Kaushik Solanki
- Mark as New
- Bookmark
- Subscribe
- Mute
- Subscribe to RSS Feed
- Permalink
- Report Inappropriate Content
How about this?
- Mark as New
- Bookmark
- Subscribe
- Mute
- Subscribe to RSS Feed
- Permalink
- Report Inappropriate Content
Hi
You have to create separate Chart and Text boxes to achieve your expected output.
- Mark as New
- Bookmark
- Subscribe
- Mute
- Subscribe to RSS Feed
- Permalink
- Report Inappropriate Content
Maybe this?
- Mark as New
- Bookmark
- Subscribe
- Mute
- Subscribe to RSS Feed
- Permalink
- Report Inappropriate Content
Interesting, Can i know after that do we require to change any setting to get the values. Because, i am not getting any values.
Can you please explain me this
dual(Only( [2014 Score]),2)
- Mark as New
- Bookmark
- Subscribe
- Mute
- Subscribe to RSS Feed
- Permalink
- Report Inappropriate Content
dual(Only( [2014 Score]),2)
this will plot a bar with size = 2 and shows the value [2014 Score]
It´s a workaround when you want to create a fixed bar showing a value
- Mark as New
- Bookmark
- Subscribe
- Mute
- Subscribe to RSS Feed
- Permalink
- Report Inappropriate Content
Hi there,
You can create a straight table with an expression like below:
In the chart properties choose Linear Gauge as the Display Option Representation
Set up the gauge properties like this:
Set the background colour to ARGB(64,128,128,128):
- Mark as New
- Bookmark
- Subscribe
- Mute
- Subscribe to RSS Feed
- Permalink
- Report Inappropriate Content
Got It, But still values not generated. For third expression i use the Offset = 1, Values are generated.
- Mark as New
- Bookmark
- Subscribe
- Mute
- Subscribe to RSS Feed
- Permalink
- Report Inappropriate Content
If you attach your qvw I can take a look and help you
- « Previous Replies
- Next Replies »