Unlock a world of possibilities! Login now and discover the exclusive benefits awaiting you.
- Qlik Community
- :
- All Forums
- :
- QlikView App Dev
- :
- Aggr in Chart Expression
- Subscribe to RSS Feed
- Mark Topic as New
- Mark Topic as Read
- Float this Topic for Current User
- Bookmark
- Subscribe
- Mute
- Printer Friendly Page
- Mark as New
- Bookmark
- Subscribe
- Mute
- Subscribe to RSS Feed
- Permalink
- Report Inappropriate Content
Aggr in Chart Expression
Hi,
I currently have this expression which works and shows the "Star" values based on the current selection:
Aggr($(vStarWeight),Star,MeasureID))
This is working fine, but now they want to be able to see a specific physician's performance compared to the entire market's. So, the Star value for the physician as a bar and the market's overall Star value as a line on the same chart. How can I create two different expressions that will show what they are asking? I've tried several things and the values keep showing as the same.
Any help is appreciated!
- Mark as New
- Bookmark
- Subscribe
- Mute
- Subscribe to RSS Feed
- Permalink
- Report Inappropriate Content
It would be helful to know more about the context of the expression (dimensions / selections), your data model and the variable definition.
In general, take care to
And to consider
Maybe try an outer aggregation with the TOTAL qualifier like
=Avg(TOTAL Aggr($(vStarWeight),Star,MeasureID))
for the market average star value.
- Mark as New
- Bookmark
- Subscribe
- Mute
- Subscribe to RSS Feed
- Permalink
- Report Inappropriate Content
Can you share a sample app if possible please ? And can you show us the expression in your vStarWeight variable ?
- Mark as New
- Bookmark
- Subscribe
- Mute
- Subscribe to RSS Feed
- Permalink
- Report Inappropriate Content
Thanks! I will try that.
The variable definition is: IF(SUM(NUMERATOR)/SUM(DENOMINATOR)>=PtileBeg and SUM(NUMERATOR)/SUM(DENOMINATOR)<= PtileEnd
,Star)
The current dimension is MeasureID. Basically, when a physician or vendor is selected they would like to see how they are doing compared to the overall Market. I am pretty sure each physician is only associated to one market, but I have a feeling a problem may be that each physician is not eligible for every MeasureID, while the Market would likely have a value for every MeasureID.
- Mark as New
- Bookmark
- Subscribe
- Mute
- Subscribe to RSS Feed
- Permalink
- Report Inappropriate Content
The variable definition is: IF(SUM(NUMERATOR)/SUM(DENOMINATOR)>=PtileBeg and SUM(NUMERATOR)/SUM(DENOMINATOR)<= PtileEnd
,Star)
Unfortunately I don't have a sample app I can share. Mine is way too big.
- Mark as New
- Bookmark
- Subscribe
- Mute
- Subscribe to RSS Feed
- Permalink
- Report Inappropriate Content
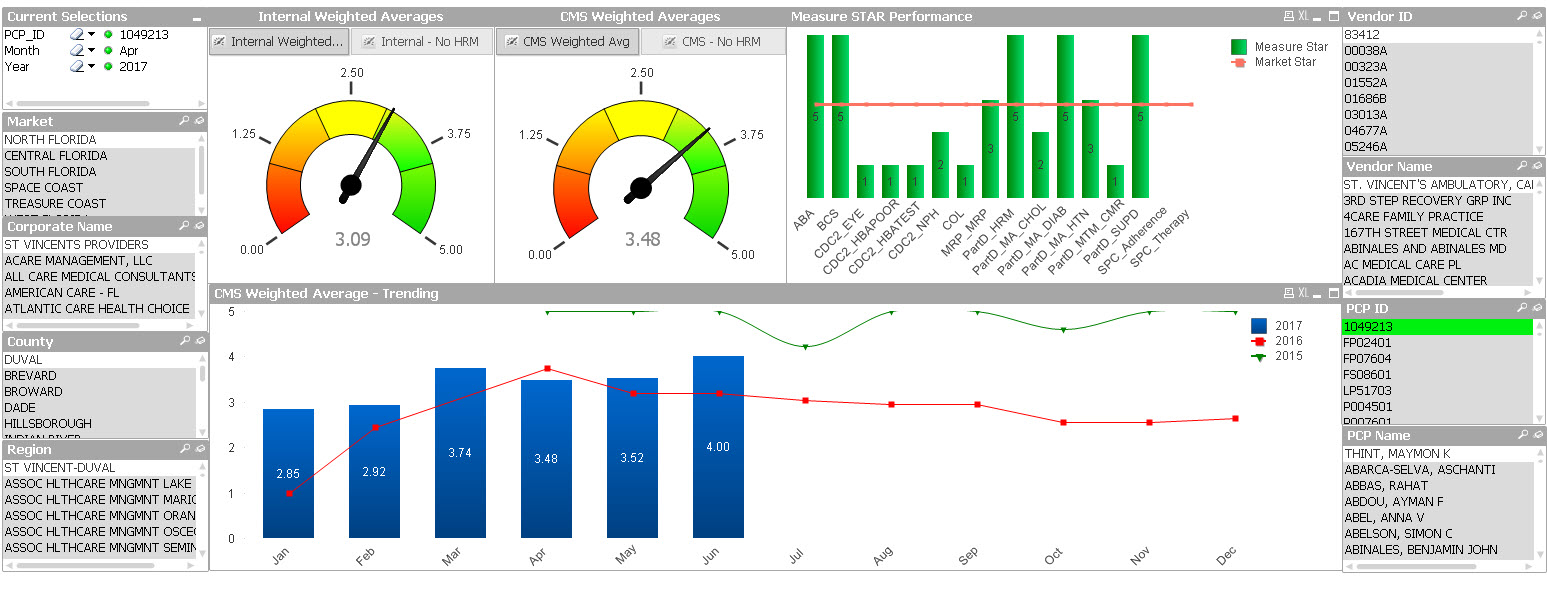
I am trying the TOTAL qualifier as a line, but it is just giving me the avg of the values of the bars across the chart. I have attached a screenshot, maybe that will help illustrate what I am needing. For instance, when PCP 1049213 is selected, I want to see the overall Market of North Florida's star performance for each measure.
- Mark as New
- Bookmark
- Subscribe
- Mute
- Subscribe to RSS Feed
- Permalink
- Report Inappropriate Content
Maybe use set analysis to select your market based on PCB selection and clear selection on that specific PCB:
IF(
SUM({<MarketField = p(), PCBField =>}NUMERATOR)/SUM({<MarketField = p(), PCBField =>} DENOMINATOR)>=PtileBeg
and
SUM({<MarketField = p(), PCBField =>}NUMERATOR)/SUM({<MarketField = p(), PCBField =>}DENOMINATOR)<= PtileEnd
,Star)
So basically change the
But sttill not sure how your expression really works and how your data model looks like.
- Mark as New
- Bookmark
- Subscribe
- Mute
- Subscribe to RSS Feed
- Permalink
- Report Inappropriate Content
I have attached the data model.
The Star value is calculated depending on where the rate (numerator/denominator) falls on the PlanLevel_Thresholds table. The StarMember_Details table houses all of the data that is needed for this calculation. What the expression currently is doing is aggregating all of the data and giving an overall Star value by MeasureID, depending on the selection.
Sorry if I am not explaining correctly! Thanks for all of your help.