Unlock a world of possibilities! Login now and discover the exclusive benefits awaiting you.
- Qlik Community
- :
- All Forums
- :
- QlikView App Dev
- :
- Create a stacked bar graph using totals from an ex...
Options
- Subscribe to RSS Feed
- Mark Topic as New
- Mark Topic as Read
- Float this Topic for Current User
- Bookmark
- Subscribe
- Mute
- Printer Friendly Page
Turn on suggestions
Auto-suggest helps you quickly narrow down your search results by suggesting possible matches as you type.
Showing results for
Not applicable
2016-08-22
05:30 AM
- Mark as New
- Bookmark
- Subscribe
- Mute
- Subscribe to RSS Feed
- Permalink
- Report Inappropriate Content
Create a stacked bar graph using totals from an expression
Hi
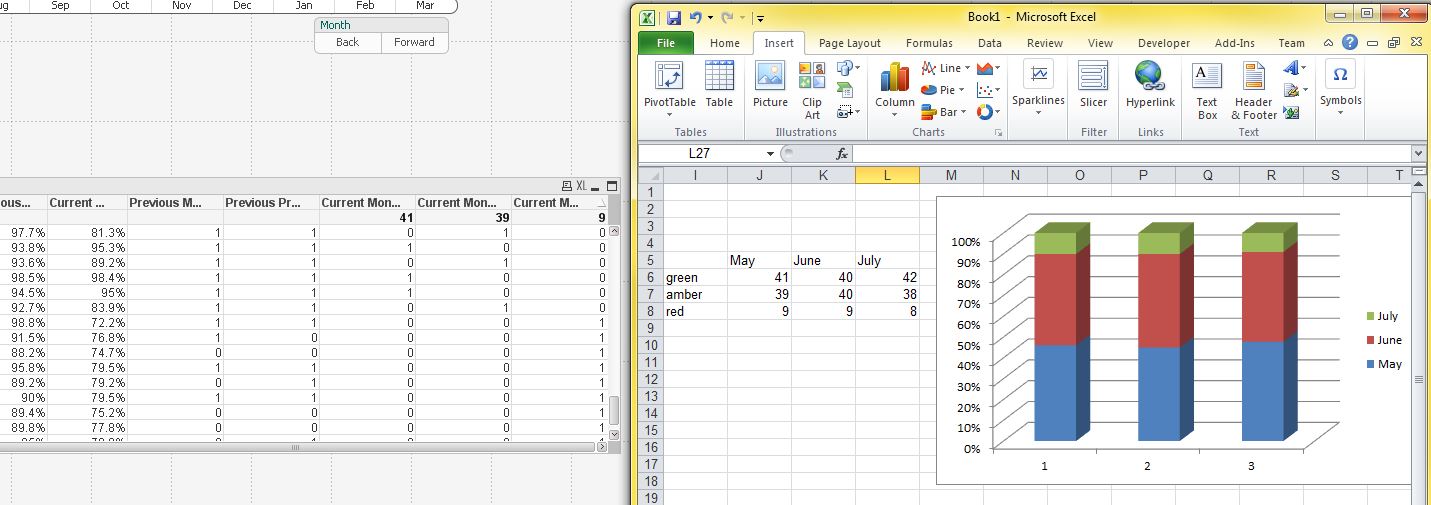
I am splitting data by ward and performing a range of calculations which assign each ward to green amber or red. I now want to create a stacked bar graph showing only the total number of wards in each category.
I can easily knock this up in excel using just the totals (see screenshot) but I want a single graph in Qlikview to do this.
Help?
186 Views
1 Reply
2016-08-22
07:55 AM
- Mark as New
- Bookmark
- Subscribe
- Mute
- Subscribe to RSS Feed
- Permalink
- Report Inappropriate Content
Use month and a calculated dimension with "a range of calculations which assign each ward to green amber or red" as dimensions and something like count(wards) as expression.
talk is cheap, supply exceeds demand
120 Views