Unlock a world of possibilities! Login now and discover the exclusive benefits awaiting you.
- Qlik Community
- :
- All Forums
- :
- QlikView App Dev
- :
- Merging Cells
- Subscribe to RSS Feed
- Mark Topic as New
- Mark Topic as Read
- Float this Topic for Current User
- Bookmark
- Subscribe
- Mute
- Printer Friendly Page
- Mark as New
- Bookmark
- Subscribe
- Mute
- Subscribe to RSS Feed
- Permalink
- Report Inappropriate Content
Merging Cells
Hi
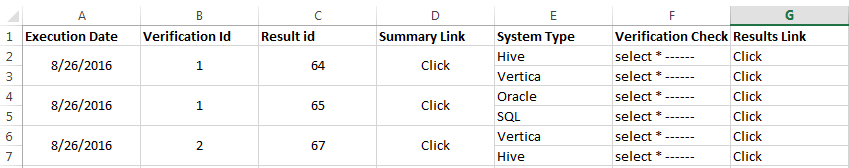
Please find the attached document , I was to format the table in the document as below.. how is it possible
Thank you
- Mark as New
- Bookmark
- Subscribe
- Mute
- Subscribe to RSS Feed
- Permalink
- Report Inappropriate Content
You can not accomplish the exact view as in Excel. The expectation in QlikView pivot table is that values are grouped in each dimension over the value in previous dimension. Int his case the expected output would be as below.
![2016-08-27 15_18_12-QlikView x64 - [C__Users_tko_Documents__slask_230614.qvw_].png](/legacyfs/online/135755_2016-08-27 15_18_12-QlikView x64 - [C__Users_tko_Documents__slask_230614.qvw_].png)
In the provided sample this is prohibited by the Execution Date not being properly formatted as a date. You can see this by showing the field in a list box and adding a expression to reveal the underlying numerical values. The decimal values in this case technically means that each value corresponds to a timestamp and not a date. This is the reason why the same date is shows multiple times in the list box, instead of the expected one occurrence per date.
![2016-08-27 15_20_50-QlikView x64 - [Test_].png](/legacyfs/online/135756_2016-08-27 15_20_50-QlikView x64 - [Test_].png)
Dates are expected to have integers as numerical values, which means in this case the decimal part need to be removed during load. This can be corrected by applying Floor() on the Execution Date field during load.
Date(Floor([Query Start Time])) as [Execution Date]
- Mark as New
- Bookmark
- Subscribe
- Mute
- Subscribe to RSS Feed
- Permalink
- Report Inappropriate Content
Thank you for the response .. is there a way that I can show just the summary link for each result id somehow .. because it does make sense to show the same link twice for each result id .. is that possible?