Unlock a world of possibilities! Login now and discover the exclusive benefits awaiting you.
- Qlik Community
- :
- All Forums
- :
- QlikView App Dev
- :
- How to make dimensions in chart works for function...
- Subscribe to RSS Feed
- Mark Topic as New
- Mark Topic as Read
- Float this Topic for Current User
- Bookmark
- Subscribe
- Mute
- Printer Friendly Page
- Mark as New
- Bookmark
- Subscribe
- Mute
- Subscribe to RSS Feed
- Permalink
- Report Inappropriate Content
How to make dimensions in chart works for function in set analysis
Hi All,
Thanks in advance for your time helping on my issues. 
First of all, this question is under a situation that I would like to build a chart with year and month as dimension to aggregate sales amount as metrics.
If I want to calculate the metrics like last 1 month, last 2 month, last 3 month ... to last n month.
To implement this I'm planning two tables in my qlikview backend
one is called Lookup_Table
| Lookup_Number | Year | Month | YearMonth |
|---|---|---|---|
| 1 | 1993 | 1 | 199301 |
| 2 | 1993 | 2 | 199302 |
| ... | ... | ... | ... |
| 792 | 2058 | 12 | 205812 |
Lookup_Number holds the row number from min to max
another is fact table
| YearMonth | Sales |
|---|---|
| 199301 | 1000 |
| 199302 | 1000 |
| ... | ... |
| ... | ... |
| 205812 | 1000 |
Sales holds the amount and all values equal 1000
By finishing these two tables I'm starting to build the straight table.
Straight table takes [Year],[Month] as dimension
sum([Sales]) as metric
I was trying first to build last 1 month expression here:
sum({<Lookup_Number={$(=max(Lookup_Number)-1)}>}[Sales])
my issue here is with this inner function in set analysis. This function works under the entire data set
for example
Year Month Last 1 Month
1993 01 0
1993 02 0
... ... 0
2058 11 1000
What I would like to see is:
Year Month Last 1 Month
1993 01 0
1993 02 1000
... ... 1000
2058 11 1000
2058 12 1000
Is there any way to make the dimension outside works for the inner function in set analysis?
Thanks!
Best Regards.
Message was edited by: Adam Gao
- Mark as New
- Bookmark
- Subscribe
- Mute
- Subscribe to RSS Feed
- Permalink
- Report Inappropriate Content
Try this or please post the application
sum({<Lookup_Number={'=$(=max(Lookup_Number)-1)'}>}[Sales])
- Mark as New
- Bookmark
- Subscribe
- Mute
- Subscribe to RSS Feed
- Permalink
- Report Inappropriate Content
Hi Anil,
I tried your set analysis seems work but result is the same as current month.
I'll also attached the application thanks. !
- Mark as New
- Bookmark
- Subscribe
- Mute
- Subscribe to RSS Feed
- Permalink
- Report Inappropriate Content
Are you looking for result as in the second column?
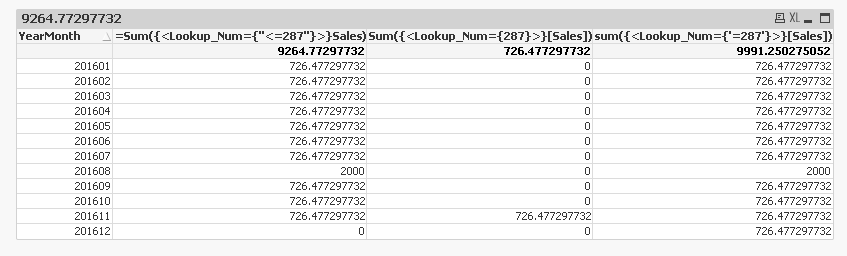
I am using this
=Sum({<Lookup_Num={"$(='<=' & (Max(Lookup_Num)-1))"}>}Sales)
Column 3 is your initial expression and Column 4 is what Anil provided. But this might only work when you have selected a particular year. Is that how you are going to be using this? If not, then you might need to use Aggr() function instead of using set analysis because set analysis is evaluated once per dimension.
But before we go any further lets confirm if this looks right when you have an year selected or not
- Mark as New
- Bookmark
- Subscribe
- Mute
- Subscribe to RSS Feed
- Permalink
- Report Inappropriate Content
Hey Adam,
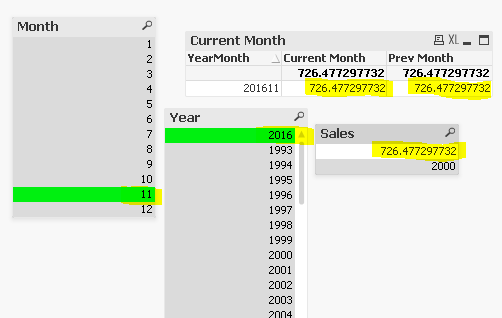
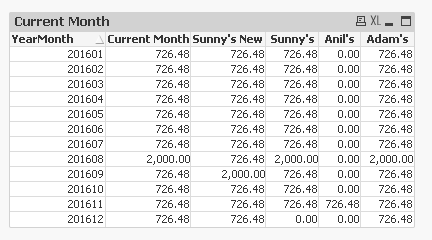
You have Forecast data, so this measure applicable for Max Year and Max Month. And you don't have data for selection of sales. Please create master calendar and then try using two expressions
Current Month -- sum({<Month={'=$(=max(Month))'}>}[Sales])
Previous Month -- sum({<Month={'=$(=max(Month)-1)'}>}[Sales])
For ref, Please have a look image
- Mark as New
- Bookmark
- Subscribe
- Mute
- Subscribe to RSS Feed
- Permalink
- Report Inappropriate Content
Hi Sunny,
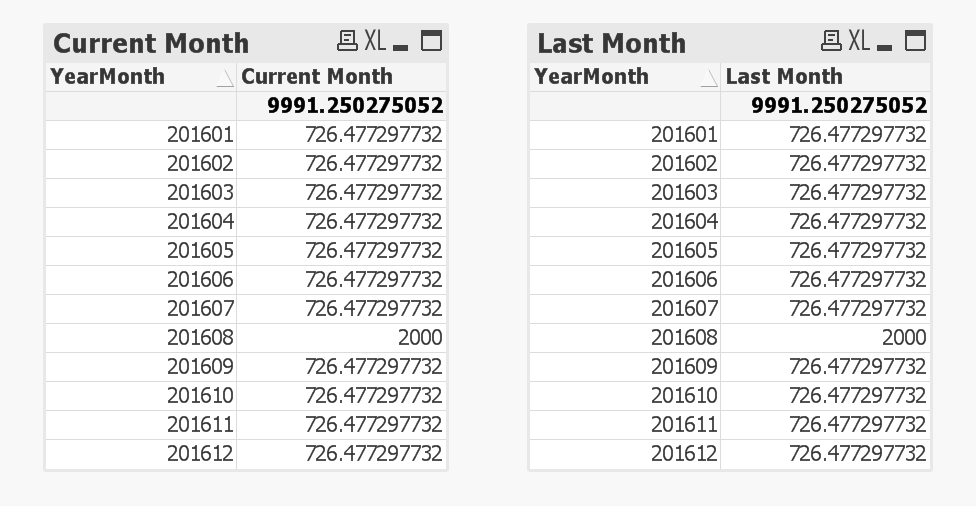
My intention is to sum last 1 month of sales amount under the year and month dimension, like I have in my following snapshot:
like we have displayed in the 6th column: for each row it contains the total of amount of last month
201601 should be corresponding to 201512 month total sales amount.
and one by one.
In my expression:sum({<Lookup_Number={$(=max(Lookup_Number)-1)}>}[Sales])
the element part $(=max(Lookup_Number)-1) is evaluated under the entire data set
and it's not applied under the year and month dimension I set in the straight table.
for example: if under the year 2016 and month 1 the lookup number should be 277 and minus 1 should be 276
then it will take the data set where lookup number is 276 that's exactly what I want.
I have tested with your expression as well but it's the same and it evaluates with entire data set.
Thanks we can keep discussing to find if it's possible to do like this.
I know there's a way to build a structure to add one more backend table AsofMonth which stores corresponding relationship between months like below:
AsofYearMonth YearMonth Type
201601 201512 LastMonth
201602 201601 LastMonth
...
this is also a good way but I would say if there's some other way to make it easier to understand and build apps without Asof tables.
Best Regards.
Adam.
- Mark as New
- Bookmark
- Subscribe
- Mute
- Subscribe to RSS Feed
- Permalink
- Report Inappropriate Content
Hi Anil,
Would you like to share the idea of Master Calendar and how it's connected with the fact?Maybe in that way I can find some helpful suggestions.
Thanks.
Adam
- Mark as New
- Bookmark
- Subscribe
- Mute
- Subscribe to RSS Feed
- Permalink
- Report Inappropriate Content
Try Above() function instead of set analysis here
=Above(Sum({<Year, YearMonth>}Sales)) * Avg(1)
- Mark as New
- Bookmark
- Subscribe
- Mute
- Subscribe to RSS Feed
- Permalink
- Report Inappropriate Content
Hi Sunny,
I would say this is a brilliant way when you only take YearMonth as dimension and only to calculate last 1 month sales amount.
I would mark it as a good solution when client request a requirements to calculate last 1 month.
But if you imagine the following two situation:
1.if we expand other dimension in the future like customer
eg:
current month
cu
customer0 201602 1000
customer1 201601 2000
customer1 201602 3000
last 1 month
customer0 201602 -
customer1 201601 1000
customer1 201602 2000
2.if we need not only last 1 month we even need last n month
Thanks.
Best Regards.
Adam
- Mark as New
- Bookmark
- Subscribe
- Mute
- Subscribe to RSS Feed
- Permalink
- Report Inappropriate Content
Adam -
1) I am not sure I understand your example in the first part. But may be you just need to use a Total with multiple dimensions
=Above(TOTAL Sum({<Year, YearMonth>}Sales)) * Avg(1)
This will look above regardless of change in any dimension, whereas if you don't have TOTAL in your expression, the output will restart everytime your second last dimension changes value.
I guess the issue would be if you multiple dimensions and you want to restart based on few of them and be continuous on few of them. Then it tends to get challenging (We can talk about this, if in case you are looking for this kind of thing)
2) I think this should be easy
=Above(Sum({<Year, YearMonth>}Sales), N) * Avg(1)
Replace N with number of months you want to go above.
I think it would be helpful if you read about Above()/Below Function here (and may be also After()/Before())