Unlock a world of possibilities! Login now and discover the exclusive benefits awaiting you.
- Qlik Community
- :
- All Forums
- :
- QlikView App Dev
- :
- How to use rangecount in qlikview?
- Subscribe to RSS Feed
- Mark Topic as New
- Mark Topic as Read
- Float this Topic for Current User
- Bookmark
- Subscribe
- Mute
- Printer Friendly Page
- Mark as New
- Bookmark
- Subscribe
- Mute
- Subscribe to RSS Feed
- Permalink
- Report Inappropriate Content
How to use rangecount in qlikview?
Hi Team,
Can any one give me example on how to count previous month data..
For example If I am having Tickets of current months along with previous month I need to show the percentage of that so how to write expression for that. If I am not wrong I need to use range count
Here I am having Tickets and Target tickets Here when I am select current month the data should accumulate with previous month and to show percentage for that
Here month field is dimension and if I select Service it should take count from june to september and to show % of that field
I.e Target tickets/Total tickets of that field.
Hope I am clear I am attaching sample data for better understanding
- « Previous Replies
-
- 1
- 2
- Next Replies »
Accepted Solutions
- Mark as New
- Bookmark
- Subscribe
- Mute
- Subscribe to RSS Feed
- Permalink
- Report Inappropriate Content
Modified example to add an As Of table. Clicking on the bars keeps the same percentage now, and all related data is selected.
AsOf:
LOAD date(fieldvalue('Month',recno())) as [Month]
AUTOGENERATE fieldvaluecount('Month')
;
LEFT JOIN (AsOf)
LOAD [Month] as [As Of Month]
RESIDENT AsOf
;
INNER JOIN (AsOf)
LOAD *
RESIDENT AsOf
WHERE [As Of Month] >= [Month]
;
Dimension = As Of Month
Expression = count([Targetmet Tickets])/count([Tickets])
- Mark as New
- Bookmark
- Subscribe
- Mute
- Subscribe to RSS Feed
- Permalink
- Report Inappropriate Content
What are you expecting, Would you please share expected result from same excel and then update new one
- Mark as New
- Bookmark
- Subscribe
- Mute
- Subscribe to RSS Feed
- Permalink
- Report Inappropriate Content
Are you expecting something like this -
A straight table with Month as dimension where each month will show the below values,
June - Count (June's Target Tickets) / Count (June's Tickets)
July - Count (June and July's Target Tickets) / Count (June and July's Tickets)
Aug - Count (June+July+Aug's Target Tickets) / Count (June+July+Aug's Tickets)
Sep - Count (June+July+Aug+Sep's Target Tickets) / Count (June+July+Aug+Sep's Tickets)
Plus you need a filter for Group and if you select a Group value say 'Service' then you need to see values related to Service alone?
Please confirm or correct this!
Regards
Harish
- Mark as New
- Bookmark
- Subscribe
- Mute
- Subscribe to RSS Feed
- Permalink
- Report Inappropriate Content
Yes Harish. I am expecting the same need to show in bar chart.
- Mark as New
- Bookmark
- Subscribe
- Mute
- Subscribe to RSS Feed
- Permalink
- Report Inappropriate Content
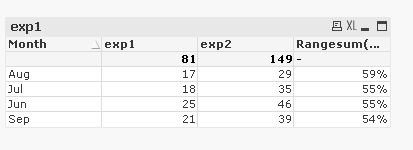
Hi Chinnu,
Hope this what yo u are looking for:
Regards
KC
KC
- Mark as New
- Bookmark
- Subscribe
- Mute
- Subscribe to RSS Feed
- Permalink
- Report Inappropriate Content
From Presentation Tab hide Exp1 and Exp2.
Regards
KC
KC
- Mark as New
- Bookmark
- Subscribe
- Mute
- Subscribe to RSS Feed
- Permalink
- Report Inappropriate Content
Please find the attached.
Hope this helps!
Regards
Harish
- Mark as New
- Bookmark
- Subscribe
- Mute
- Subscribe to RSS Feed
- Permalink
- Report Inappropriate Content
Did this work?
Regards
Harish
- Mark as New
- Bookmark
- Subscribe
- Mute
- Subscribe to RSS Feed
- Permalink
- Report Inappropriate Content
Hi Harish,
Thanks for your help it's working fine But one question when we click on the individual bars it showing different percentages Because Why I am asking is Users will click on the individual bars and they will check the related data on back end So can you please advise on this...
- Mark as New
- Bookmark
- Subscribe
- Mute
- Subscribe to RSS Feed
- Permalink
- Report Inappropriate Content
Modified example to add an As Of table. Clicking on the bars keeps the same percentage now, and all related data is selected.
AsOf:
LOAD date(fieldvalue('Month',recno())) as [Month]
AUTOGENERATE fieldvaluecount('Month')
;
LEFT JOIN (AsOf)
LOAD [Month] as [As Of Month]
RESIDENT AsOf
;
INNER JOIN (AsOf)
LOAD *
RESIDENT AsOf
WHERE [As Of Month] >= [Month]
;
Dimension = As Of Month
Expression = count([Targetmet Tickets])/count([Tickets])
- « Previous Replies
-
- 1
- 2
- Next Replies »