Unlock a world of possibilities! Login now and discover the exclusive benefits awaiting you.
- Qlik Community
- :
- Forums
- :
- Analytics
- :
- App Development
- :
- Qlik Sense Simple Heatmap in Table
- Subscribe to RSS Feed
- Mark Topic as New
- Mark Topic as Read
- Float this Topic for Current User
- Bookmark
- Subscribe
- Mute
- Printer Friendly Page
- Mark as New
- Bookmark
- Subscribe
- Mute
- Subscribe to RSS Feed
- Permalink
- Report Inappropriate Content
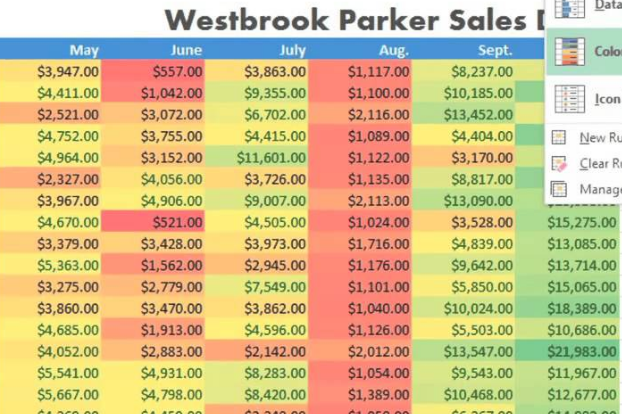
Qlik Sense Simple Heatmap in Table
I am trying to create the effect that is easily done in Excel below in a table in Qlik Sense.
Any help is appreciated.
Thank you,
- dave
Accepted Solutions
- Mark as New
- Bookmark
- Subscribe
- Mute
- Subscribe to RSS Feed
- Permalink
- Report Inappropriate Content
Thanks for the help Mark. I guess I am taking for granted that this is an "easy" thing to do in other programs like Excel, Google DataStudio, etc ..
I followed the post below and created three variables which I then used in a background color expression. Very cumbersome process to get what I feel is a simple results.
- Mark as New
- Bookmark
- Subscribe
- Mute
- Subscribe to RSS Feed
- Permalink
- Report Inappropriate Content
Hard to answer without knowing what your colors are based on.
In QS you can build an expression to control the background color and text colors in each cell. You go to edit mode and then expand the dimension or measure properties and add an expression for the colors.
But I would really need a better idea of what you are doing to give you any better answer than that.
- Mark as New
- Bookmark
- Subscribe
- Mute
- Subscribe to RSS Feed
- Permalink
- Report Inappropriate Content
Thanks for the help Mark. I guess I am taking for granted that this is an "easy" thing to do in other programs like Excel, Google DataStudio, etc ..
I followed the post below and created three variables which I then used in a background color expression. Very cumbersome process to get what I feel is a simple results.
- Mark as New
- Bookmark
- Subscribe
- Mute
- Subscribe to RSS Feed
- Permalink
- Report Inappropriate Content
I took a very simple apporach:
=RGB(255,
255-(<your_kpi>),
255-(<your_kpi>)
)