Unlock a world of possibilities! Login now and discover the exclusive benefits awaiting you.
- Qlik Community
- :
- Forums
- :
- Analytics
- :
- New to Qlik Analytics
- :
- Chart Size Problems - Legends and Axis Labels
- Subscribe to RSS Feed
- Mark Topic as New
- Mark Topic as Read
- Float this Topic for Current User
- Bookmark
- Subscribe
- Mute
- Printer Friendly Page
- Mark as New
- Bookmark
- Subscribe
- Mute
- Subscribe to RSS Feed
- Permalink
- Report Inappropriate Content
Chart Size Problems - Legends and Axis Labels
Hi,
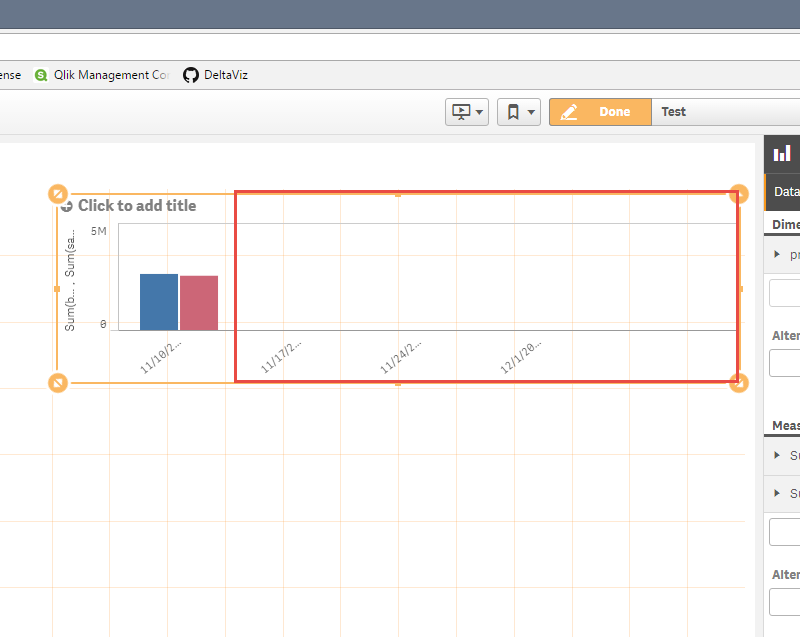
I've recently started using Qlik Sense, and I've noticed that there is very poor behavior when it comes to chart sizes with regards to chart legends and chart labels. Here's an example from an app that I made:
With the standard combo chart 4 grids in height, which is 1/3 of the total vertical space, Qlik Sense hides the chart legend despite huge amounts of empty space in the visualization for the legend. If made smaller, it will eventually hide the axes labels also.
When the chart is increased to 5 grids in height, the legend reappears.
Is there any way to change this behavior, and if not, are there any plans to preserve basic data on charts like legends and axis labels when there's clearly enough white space to do so?
This seems like very, very poor behavior from a visualization tool.
- Mark as New
- Bookmark
- Subscribe
- Mute
- Subscribe to RSS Feed
- Permalink
- Report Inappropriate Content
I can't reproduce the problem with the limit you're talking about. Here the legend shows just fine with a height of 3 grid units.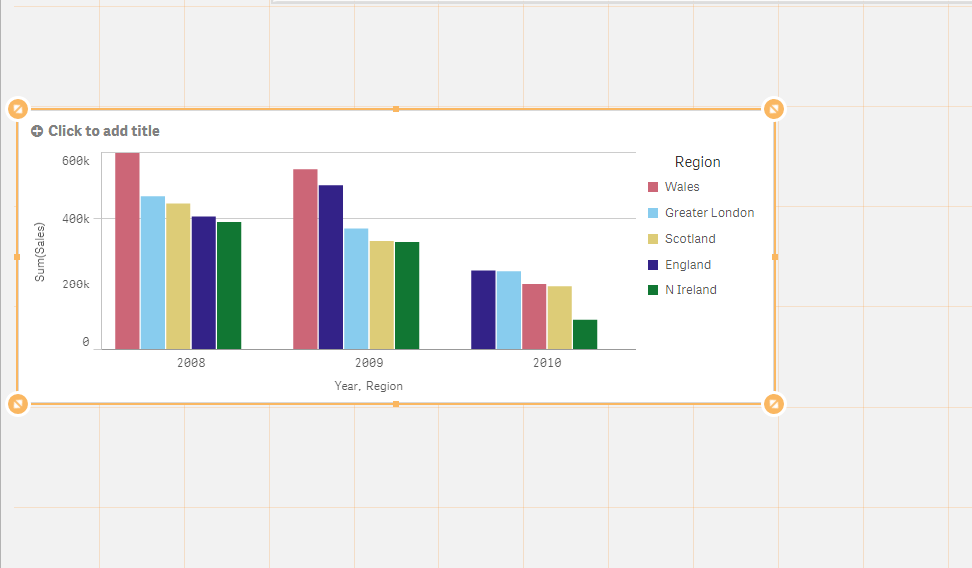
But perhaps that's because my monitor is set at a higher resolution than yours.
Qlik Sense will automatically adapt to available screen space. This feature is called Responsive Design. It cannot be turned off. But it does make it possible to use the same app on a big pc screen, a laptop, a tablet and a smartphone and in all those cases see something usable. Qlik Sense is not a pixel perfect what-you-see-is-what-you-get fixed display kind of tool.
talk is cheap, supply exceeds demand
- Mark as New
- Bookmark
- Subscribe
- Mute
- Subscribe to RSS Feed
- Permalink
- Report Inappropriate Content
Hi Grant,
Gyspert is right in regards to responsive design. It is sometimes painful, but it is also a buty of the tool. Try using different screen with Full HD resolution as an example.
you will see labels for sure 
regards
Lech
- Mark as New
- Bookmark
- Subscribe
- Mute
- Subscribe to RSS Feed
- Permalink
- Report Inappropriate Content
I'm experiencing the problem consistently across multiple displays. It seems to me that a chart with no axis labels or a legend to designate what the information you're looking at is isn't actually that usable at all.
My 24 inch 1920x1080 desktop display at 3 grid heights:
A 60" LCD TV at 1600 x 900:
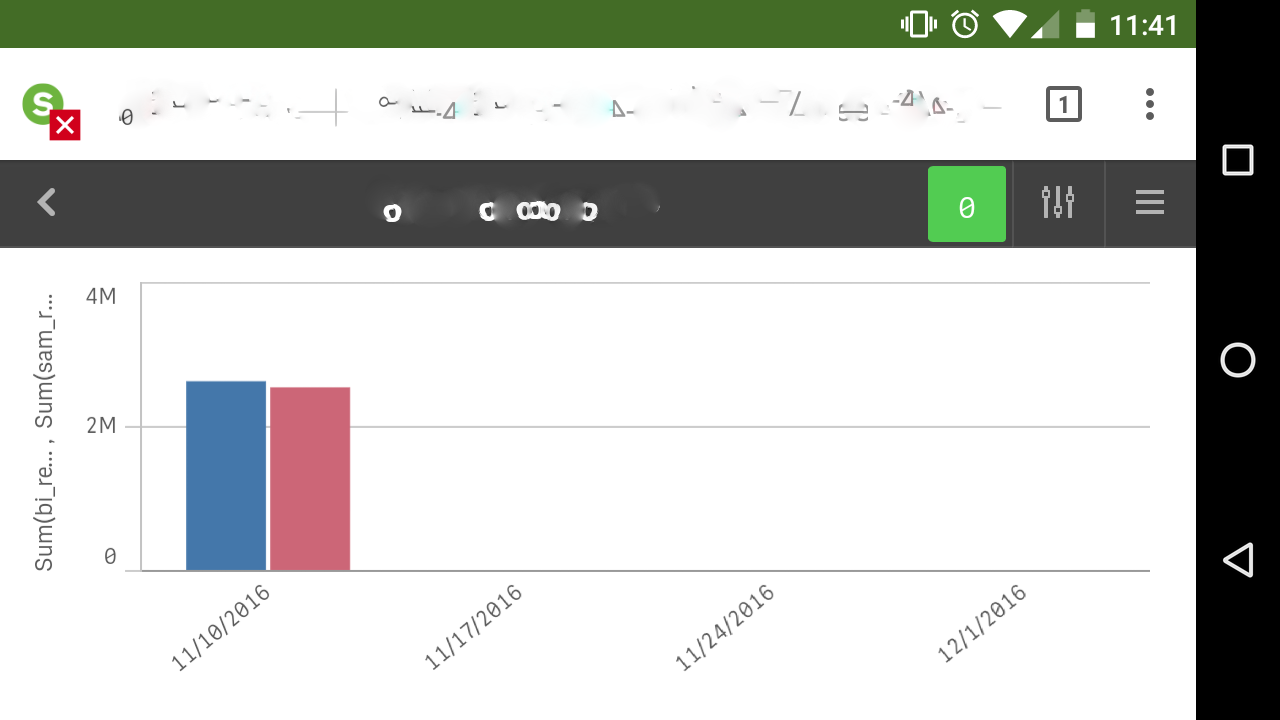
A smartphone at 720x1280:
I've tried every resolution except non-standard resolutions and ~4K resolutions and this behavior is quite consistent for me.
Maybe this is more of a bug since it seems like there are not any options to control the behavior of Responsive Design, but the problem I'm experiencing is that Responsive Design is decidely not adapting to the given screen space. As you can see from my screen shots, there is a tremendous amount of space available for a legend and yet no legend appears.
Are there any known issues with certain display drivers that might be causing this?
- Mark as New
- Bookmark
- Subscribe
- Mute
- Subscribe to RSS Feed
- Permalink
- Report Inappropriate Content
What I'm seeing is values on the x-axis where there are no bars. That space is not available for the legend. Try suppressing the null values for your x-axis dimension by unchecking the Show null values option.
talk is cheap, supply exceeds demand
- Mark as New
- Bookmark
- Subscribe
- Mute
- Subscribe to RSS Feed
- Permalink
- Report Inappropriate Content
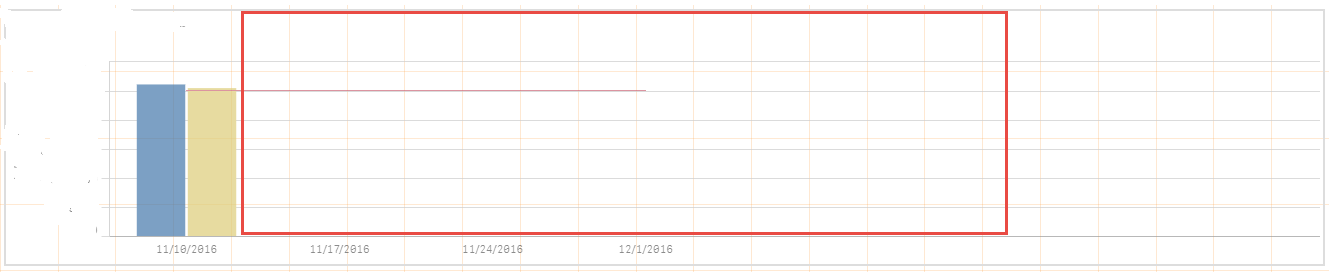
This chart is meant to only show completed weeks of data, so the bars will expand to the "null" data points further in the month when more complete data becomes available. The data points exist on the chart because the original intent was to also have a line graph showing weekly projections for the month and the bars indicating actual performance compared to that projection.
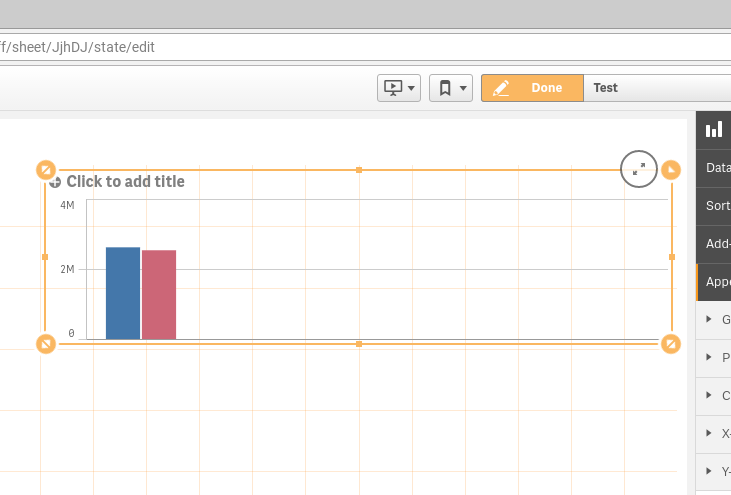
However, none of this changes the behavior in question. I modified the chart to contain only one single data point, and then made it 3 grids high, and the entire grid width, and still no legend:
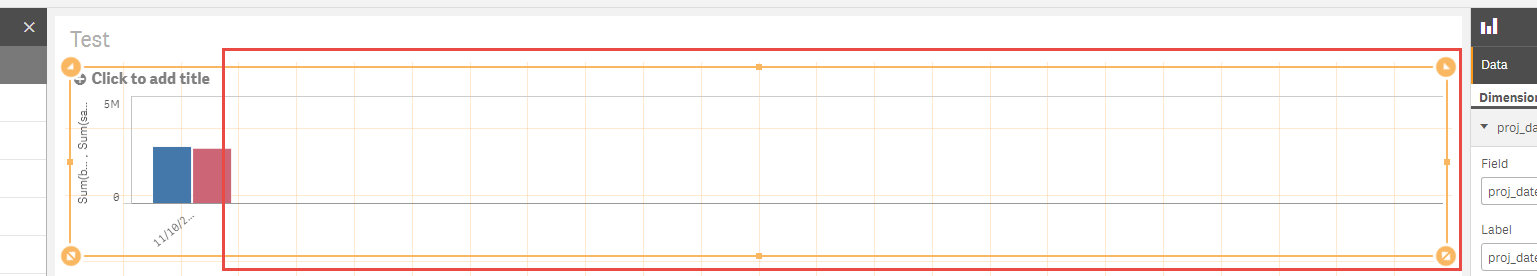
And again, this is across multiple displays, multiple resolutions, etc. Behavior like this makes it very difficult to use anything built in the app.
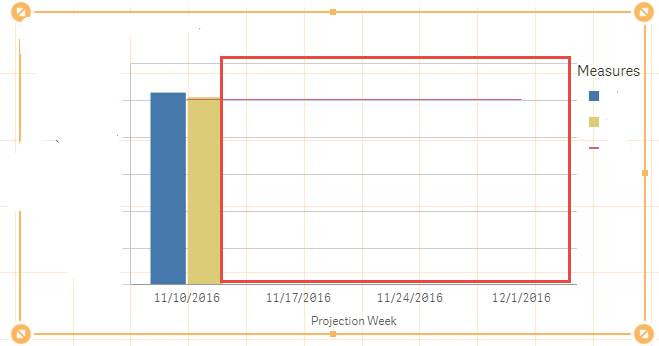
To compare, here's the exact same visualization except 4 grids in height:
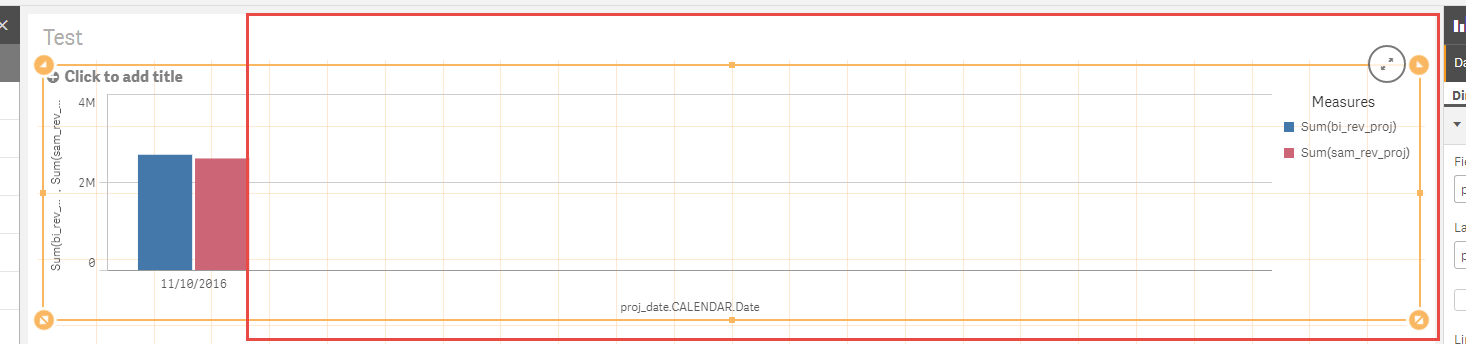
I find it difficult to accept that there "is not enough room" in that first picture for that tiny legend and axis label when 90% of the space used is white space.
- Mark as New
- Bookmark
- Subscribe
- Mute
- Subscribe to RSS Feed
- Permalink
- Report Inappropriate Content
Well, I agree. But that's not going to help. Qlik Sense has been programmed to decide that in this case there isn't enough space. You can either give it enough height to change its mind about that or create an extension that behaves the way you think it should.
talk is cheap, supply exceeds demand
- Mark as New
- Bookmark
- Subscribe
- Mute
- Subscribe to RSS Feed
- Permalink
- Report Inappropriate Content
Usually it's pretty slick resizing charts but in this case it didn't work out optimally I guess it's just frustrating because a grid size limitation in one object affects the real estate for the entire rest of the app.
I think in the future however, Responsive Design might have to give some more consideration or precedence for labels and legends, because a chart without a label or legend isn't good for much.
There are a number of visualization extensions however and maybe one of them is better suited for my purposes, or maybe I can figure out how to create my own. Thanks for the suggestion that's a promising option.