Unlock a world of possibilities! Login now and discover the exclusive benefits awaiting you.
- Qlik Community
- :
- All Forums
- :
- QlikView App Dev
- :
- Average across months in a pivot table
- Subscribe to RSS Feed
- Mark Topic as New
- Mark Topic as Read
- Float this Topic for Current User
- Bookmark
- Subscribe
- Mute
- Printer Friendly Page
- Mark as New
- Bookmark
- Subscribe
- Mute
- Subscribe to RSS Feed
- Permalink
- Report Inappropriate Content
Average across months in a pivot table
Hi,
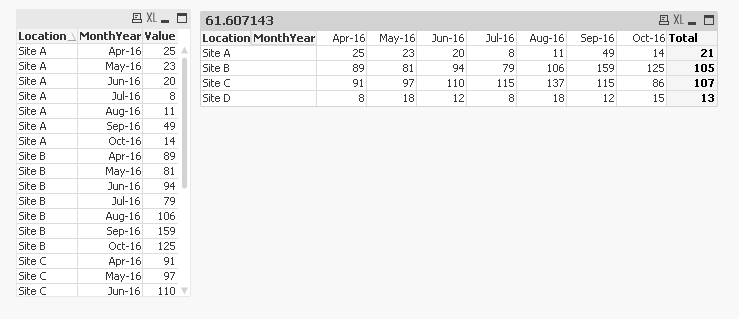
I'm trying to show an average activity figure across YTD months either replacing the total that you get from a partial sum or as well as (see excel example below)
| Location | Apr-16 | May-16 | Jun-16 | Jul-16 | Aug-16 | Sep-16 | Oct-16 | Total | Average |
|---|---|---|---|---|---|---|---|---|---|
| Site A | 25 | 23 | 20 | 8 | 11 | 49 | 14 | 150 | 21 |
| Site B | 89 | 81 | 94 | 79 | 106 | 159 | 125 | 733 | 105 |
| Site C | 91 | 97 | 110 | 115 | 137 | 115 | 86 | 751 | 107 |
| Site D | 8 | 18 | 12 | 8 | 18 | 12 | 15 | 91 | 13 |
I've read a fair amount that suggests you can do this at row total level, but haven't yet worked out how to do this at column level, if it is indeed possible.
Sorry if this has been discussed elsewhere, I've not been able to find the answer I need yet!
Accepted Solutions
- Mark as New
- Bookmark
- Subscribe
- Mute
- Subscribe to RSS Feed
- Permalink
- Report Inappropriate Content
Replacing the total should be easy. Try this
Avg(Aggr(YourExpression, Location, MonthYear))
- Mark as New
- Bookmark
- Subscribe
- Mute
- Subscribe to RSS Feed
- Permalink
- Report Inappropriate Content
Replacing the total should be easy. Try this
Avg(Aggr(YourExpression, Location, MonthYear))
- Mark as New
- Bookmark
- Subscribe
- Mute
- Subscribe to RSS Feed
- Permalink
- Report Inappropriate Content
So this gives me 'averages' of:
Site A - 6
Site B - 31
Site C - 31
Site D - 4
Which is slightly where I got to earlier, but I've no idea what those numbers relate to, unless it's giving me the average per month, rather than of the 7 months combined?
- Mark as New
- Bookmark
- Subscribe
- Mute
- Subscribe to RSS Feed
- Permalink
- Report Inappropriate Content
Not sure what the issue is?