Unlock a world of possibilities! Login now and discover the exclusive benefits awaiting you.
- Qlik Community
- :
- All Forums
- :
- QlikView App Dev
- :
- Add a summary column
- Subscribe to RSS Feed
- Mark Topic as New
- Mark Topic as Read
- Float this Topic for Current User
- Bookmark
- Subscribe
- Mute
- Printer Friendly Page
- Mark as New
- Bookmark
- Subscribe
- Mute
- Subscribe to RSS Feed
- Permalink
- Report Inappropriate Content
Add a summary column
Hello everyone,
I created a PivotChart that gives me the numbers of purchase order and products ordered, in column months and under each month the quantities ordered and quantities delivered, how I can add a column that calculates the remainder (sum quan ordered - sum quantity delivered ) But this column of remaining should not be repeated every month but rather a single column at the end of the table
thank you
| Month | janv-16 | févr-16 | remaining | |||
| N° PO | Product | quantity ordered | quantity delivered | Quantity ordered | quantity delivered | |
| 1 | A | 200 | 100 | 200 | 0 | 300 |
| 2 | B | 200 | 50 | 0 | 50 | 100 |
| 3 | A | 200 | 50 | 200 | 50 | 300 |
| 3 | B | 200 | 0 | 0 | 50 | 150 |
Ce message a été modifié par : Zoubir Bouchenafa
- « Previous Replies
-
- 1
- 2
- Next Replies »
Accepted Solutions
- Mark as New
- Bookmark
- Subscribe
- Mute
- Subscribe to RSS Feed
- Permalink
- Report Inappropriate Content
Try Calculated Dimension:
It will give one single coulmn.
=Aggr(rangesum(sum (Amount ordered) , - sum(quantity delivered),Produit,MonthYear)
- Mark as New
- Bookmark
- Subscribe
- Mute
- Subscribe to RSS Feed
- Permalink
- Report Inappropriate Content
Try Calculated Dimension:
It will give one single coulmn.
=Aggr(rangesum(sum (Amount ordered) , - sum(quantity delivered),Produit,MonthYear)
- Mark as New
- Bookmark
- Subscribe
- Mute
- Subscribe to RSS Feed
- Permalink
- Report Inappropriate Content
=Aggr(rangesum(Sum(quantits ordered)-Sum(quantity delivered),Producit,Month)). It always gives me Error in expression
tthank you for your help
- Mark as New
- Bookmark
- Subscribe
- Mute
- Subscribe to RSS Feed
- Permalink
- Report Inappropriate Content
Check syntaxis:
=Aggr(rangesum(
(quantits ordered)
,
-1*(quantity delivered)
)
,Producit,Month)
- Mark as New
- Bookmark
- Subscribe
- Mute
- Subscribe to RSS Feed
- Permalink
- Report Inappropriate Content
it calculates but for each month 
- Mark as New
- Bookmark
- Subscribe
- Mute
- Subscribe to RSS Feed
- Permalink
- Report Inappropriate Content
Try to add if condition and / or disregard nulls in the chart
- Mark as New
- Bookmark
- Subscribe
- Mute
- Subscribe to RSS Feed
- Permalink
- Report Inappropriate Content
I'm still beginner on Qlikview , can you explain more plz
- Mark as New
- Bookmark
- Subscribe
- Mute
- Subscribe to RSS Feed
- Permalink
- Report Inappropriate Content
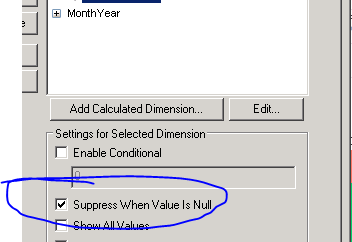
Check this box in Dimension Tab
- Mark as New
- Bookmark
- Subscribe
- Mute
- Subscribe to RSS Feed
- Permalink
- Report Inappropriate Content
but value is not null so it will not be supressed
- Mark as New
- Bookmark
- Subscribe
- Mute
- Subscribe to RSS Feed
- Permalink
- Report Inappropriate Content
Maybe try another approach since your data is in columns not in rows . Try a cross table? (sorry myself am a newbie but my instructor said that the best way is to keep data in rows not columns)
- « Previous Replies
-
- 1
- 2
- Next Replies »