Unlock a world of possibilities! Login now and discover the exclusive benefits awaiting you.
- Qlik Community
- :
- Forums
- :
- Analytics
- :
- New to Qlik Analytics
- :
- Sum of Count of top 15 items
- Subscribe to RSS Feed
- Mark Topic as New
- Mark Topic as Read
- Float this Topic for Current User
- Bookmark
- Subscribe
- Mute
- Printer Friendly Page
- Mark as New
- Bookmark
- Subscribe
- Mute
- Subscribe to RSS Feed
- Permalink
- Report Inappropriate Content
Sum of Count of top 15 items
I have an expression that calculates the count of certain complaints. I have then calculated the sum of those counts based on te product component. But the thing I need now is the sum of top 15 counts.
I want this to be done in the expression itself since I want to display this separately in a text object. Below is the expression I have come up with so far. Seeking further help. Thanks in advance.
=Sum(aggr(Count({<CAL_QUARTER={$(vPrevQuarter)},DealerZone={'WEST'}>}[Complaint Number]), [Product Component]))
- Mark as New
- Bookmark
- Subscribe
- Mute
- Subscribe to RSS Feed
- Permalink
- Report Inappropriate Content
Perhaps like this:
=Sum(aggr(Count({<[Product Component]={"=rank(Count({<CAL_QUARTER={$(vPrevQuarter)},DealerZone={'WEST'}>}[Complaint Number]))<=15"},CAL_QUARTER={$(vPrevQuarter)},DealerZone={'WEST'}>}[Complaint Number]), [Product Component]))
talk is cheap, supply exceeds demand
- Mark as New
- Bookmark
- Subscribe
- Mute
- Subscribe to RSS Feed
- Permalink
- Report Inappropriate Content
Here I did this in Consumer Sales app that is provided with Qlik Sense as a demo.
I used the bar chart Sales Rep Revenue in Sales Rep Performance Sheet.
Create a variable like this.
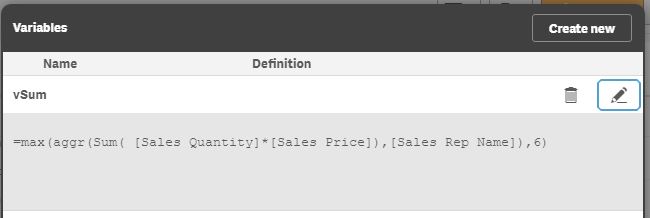
* I am doing this for Sum of Top 5 that's why you'll find a 6, Don't forget equal sign.
Then use below expression.
Sum(
aggr(
if( Sum( [Sales Quantity]*[Sales Price])>$(vSum)+0.001,
Sum( [Sales Quantity]*[Sales Price]),
0
),
[Sales Rep Name]
)
)
For some unknown reason I have to add a minute value in $(vSum).
You will get Sum for top 5 Sales Rep.
Hope you can replicate this in your app.
- Mark as New
- Bookmark
- Subscribe
- Mute
- Subscribe to RSS Feed
- Permalink
- Report Inappropriate Content
Thank for the suggestion.
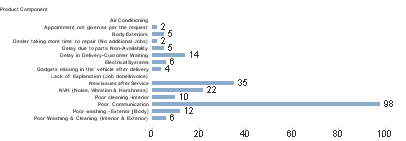
I think the below example would explain my exact requirement. As shown in the below bar graph, it has the count of complaints for a region based on certain criteria. I have set the dimension limit(for Product component) to top 15. Now I need to find the total of the values on the data points(i.e 221) and display in in the title.
the expression that used for the count is
=Count({<CAL_YEAR={'$(=Max(CAL_YEAR))'},CAL_QUARTER={$(vPrevQuarter)},DealerZone={'WEST'}>}[Complaint Number])
- Mark as New
- Bookmark
- Subscribe
- Mute
- Subscribe to RSS Feed
- Permalink
- Report Inappropriate Content
In my answer I calculated 6th largest value (vSum) and then in sum expression, I added only values that were greater than that 6th value.
So your vSum will be
=max(
aggr(
Count({<CAL_YEAR={'$(=Max(CAL_YEAR))'},CAL_QUARTER={$(vPrevQuarter)},DealerZone={'WEST'}>}[Complaint Number]),
[Product Component]
),
16
)
And your Sum expression will be
Sum(
aggr(
if( Count({<CAL_YEAR={'$(=Max(CAL_YEAR))'},CAL_QUARTER={$(vPrevQuarter)},DealerZone={'WEST'}>}[Complaint Number]) >$(vSum)+0.001,
Count({<CAL_YEAR={'$(=Max(CAL_YEAR))'},CAL_QUARTER={$(vPrevQuarter)},DealerZone={'WEST'}>}[Complaint Number]),
0
),
[Product Component]
)
)