Unlock a world of possibilities! Login now and discover the exclusive benefits awaiting you.
- Qlik Community
- :
- Forums
- :
- Analytics
- :
- App Development
- :
- Histogram of histogram
- Subscribe to RSS Feed
- Mark Topic as New
- Mark Topic as Read
- Float this Topic for Current User
- Bookmark
- Subscribe
- Mute
- Printer Friendly Page
- Mark as New
- Bookmark
- Subscribe
- Mute
- Subscribe to RSS Feed
- Permalink
- Report Inappropriate Content
Histogram of histogram
Hello community!
I am a basic but regular user of Qlik Sense, I try to represent several aggregations of data from an excel file (from a log file) and I hold on the representation ...
The Excel file contains only one table with the Date (dd / mm / yyyy) columns, Weight (format #, ## Kg) and NumCommand (unique text ID).
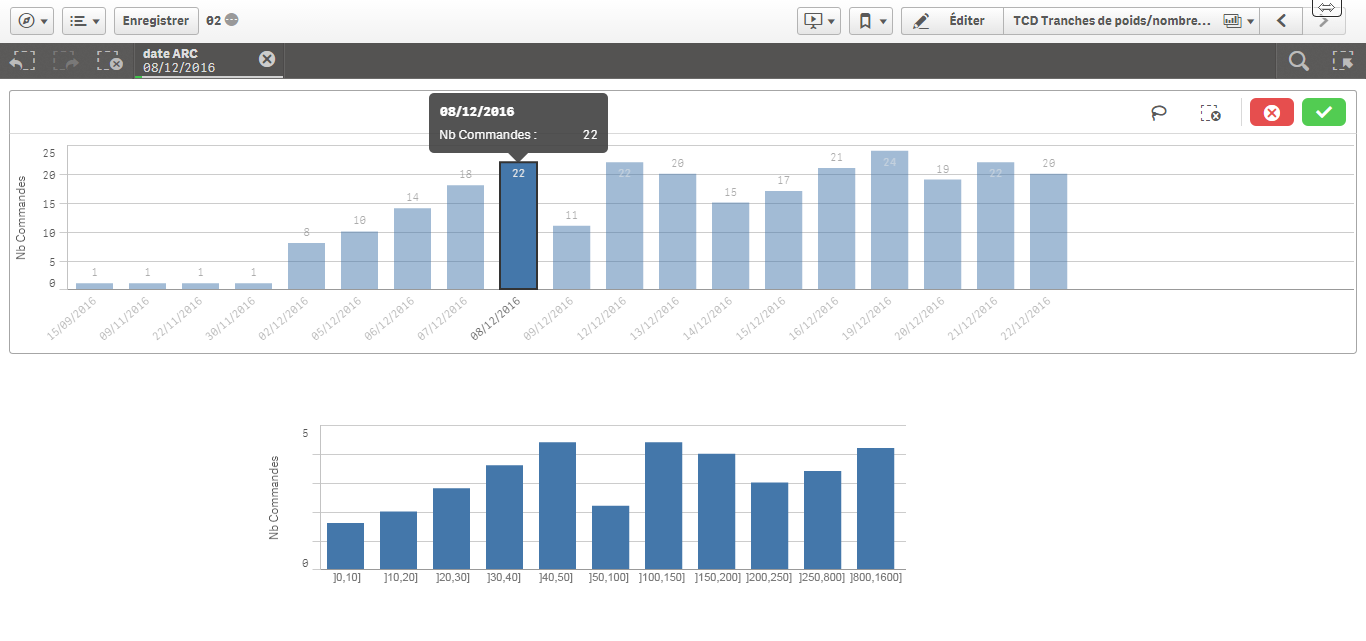
I created a first histogram showing the number of orders / day (this one is easy)
Below I want to create a second histogram that shows the details of the weights / day so that by selecting a day in the first histogram, the detail of that day is displayed in the second histogram.
The detail is that in this second histogram, I have to present the data in the following way:
- Number of orders per 10Kg range from 0 to 50Kg
- Number of orders per 50Kg range from 50 to 250Kg
- Number of orders per 800Kg range from 250 to 800Kg, 800 to 1600Kg and 1600 to 2400Kg
I am open to other representations, I have tried with a pivot table (rows and columns are ok) but I can not translate it into a graphical representation after ...
The ideal image concept (photo editing)
- Tags:
- histogramm
- Mark as New
- Bookmark
- Subscribe
- Mute
- Subscribe to RSS Feed
- Permalink
- Report Inappropriate Content
for the second histogram you can create a Dimension using Class() finction.
Try using Class with Set analysis to define the range (10 kg / 50 Kg / 800 kg)
lets try to develop with just one range first and we can then take it forward from there.
Share what you find
- Mark as New
- Bookmark
- Subscribe
- Mute
- Subscribe to RSS Feed
- Permalink
- Report Inappropriate Content
Thank you for your quick reply!
Please, could you be more specific about a Dimension using "Set Analysis" and "Class", I looked at these functions but I didn't find how to implement it in my usecase...
- Mark as New
- Bookmark
- Subscribe
- Mute
- Subscribe to RSS Feed
- Permalink
- Report Inappropriate Content
Hi Olivier,
Dimension of histogram:
If(Weight < 50, Class(Weight, 10),
If(Weight >= 50 And Weight < 250, Class(Weight, 50),
If(Weight >= 250 And Weight < 800, Class(Weight, 550,'x',250),
Class(Weight, 800)
)))
histogram expression: Count(NumCommand).
A chart should be sorted alphabetically by dimension.
Regards,
Andrey
- Mark as New
- Bookmark
- Subscribe
- Mute
- Subscribe to RSS Feed
- Permalink
- Report Inappropriate Content
Thank you for your quick reply, it works fine and now I understood how it works!
- Mark as New
- Bookmark
- Subscribe
- Mute
- Subscribe to RSS Feed
- Permalink
- Report Inappropriate Content
If your question is now answered, please flag the Correct Answer (via the big "Correct Answer" button near every post) and Helpful Answers (found under the Actions menu under every post).
If not, please make clear what part of this topic you still need help with  .
.