Unlock a world of possibilities! Login now and discover the exclusive benefits awaiting you.
- Qlik Community
- :
- Forums
- :
- Analytics
- :
- App Development
- :
- Qlik Sense color expression issue
- Subscribe to RSS Feed
- Mark Topic as New
- Mark Topic as Read
- Float this Topic for Current User
- Bookmark
- Subscribe
- Mute
- Printer Friendly Page
- Mark as New
- Bookmark
- Subscribe
- Mute
- Subscribe to RSS Feed
- Permalink
- Report Inappropriate Content
Qlik Sense color expression issue
Hi Everyone,
I have the following graph that is using set analysis to limit what it displays. This works great and do not have any issues.
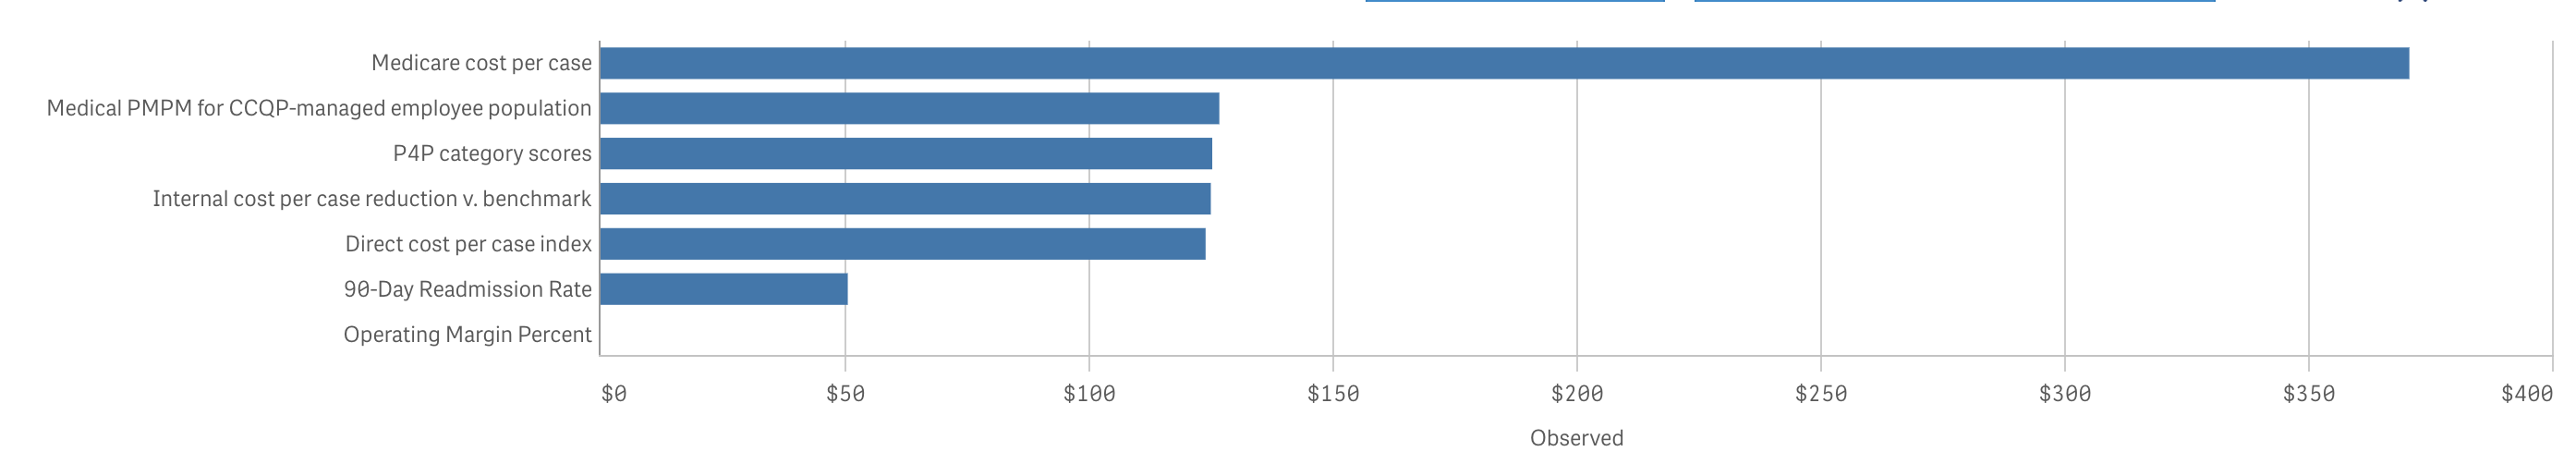
measure for chart above = avg({<StrategicAim={"Organizational Vitality"}>}ObservedNumerator)
However, when I try to add an expression to change the bars to red or green based on the target, the bar colors change, but I lose my set analysis and it pulls everything back in. Below is the color expression I am using. I am hoping I am doing something wrong here. I think I am missing something with "IF (DesiredDirectionUp=-1" but not sure.
IF (DesiredDirectionUp=-1,
IF (AVG({<StrategicAim={"Organizational Vitality"}>}ObservedNumerator)
>=
avg({<StrategicAim={"Organizational Vitality"}>}[Target (OHTargets)]),red(),green()),
IF (AVG({<StrategicAim={"Organizational Vitality"}>}ObservedNumerator)
<=
avg({<StrategicAim={"Organizational Vitality"}>}[Target (OHTargets)]),Green(),Red()))
Thank you!
- Mark as New
- Bookmark
- Subscribe
- Mute
- Subscribe to RSS Feed
- Permalink
- Report Inappropriate Content
Where are you putting this expression?
If you replaced your measure with the new version for the colors then it will no longer do what it was doing before.
If want to control colors you should put this expression in the Appearance/Colors and Legends and do a color by expression.
- Mark as New
- Bookmark
- Subscribe
- Mute
- Subscribe to RSS Feed
- Permalink
- Report Inappropriate Content
This expression is in the measure for the graph:
avg({<StrategicAim={"Organizational Vitality"}>}ObservedNumerator)
This expression is in the color by expression field:
IF (DesiredDirectionUp=-1,
IF (AVG({<StrategicAim={"Organizational Vitality"}>}ObservedNumerator)
>=
avg({<StrategicAim={"Organizational Vitality"}>}[Target (OHTargets)]),red(),green()),
IF (AVG({<StrategicAim={"Organizational Vitality"}>}ObservedNumerator)
<=
avg({<StrategicAim={"Organizational Vitality"}>}[Target (OHTargets)]),Green(),Red()))
- Mark as New
- Bookmark
- Subscribe
- Mute
- Subscribe to RSS Feed
- Permalink
- Report Inappropriate Content
I am having the same issue with a set of charts I am making. I have trend charts by FY. I only want to show the trend for 2 years and I want to specify what color each year is.
Making the chart is easy, but when I use the color by expression I get data for the other FY equal to all zeros which makes my trend line look flat.
When I changed my equation from set notation to if statements I was able to specify the colors of the lines without any problems.